5.14. Legend action button description
Below is a typical measurement le. A le is a container of the tests.
5.15. Correlation analysis
Correlation analysis is based on cross-correlation between two curves. Three options are available:
1. Cross-correlation
The Correlation analysis uses same calculations as DL/T 911-2004 Analyzer (see below for more details) but
it is possible to modify, if analysis is based on LRxy or Rxy variable for calculations, number of frequency
ranges analyzed, frequency limits and interpretation limits.
2. Analysis based on DL/T 911-2004 standard (see below for more details)
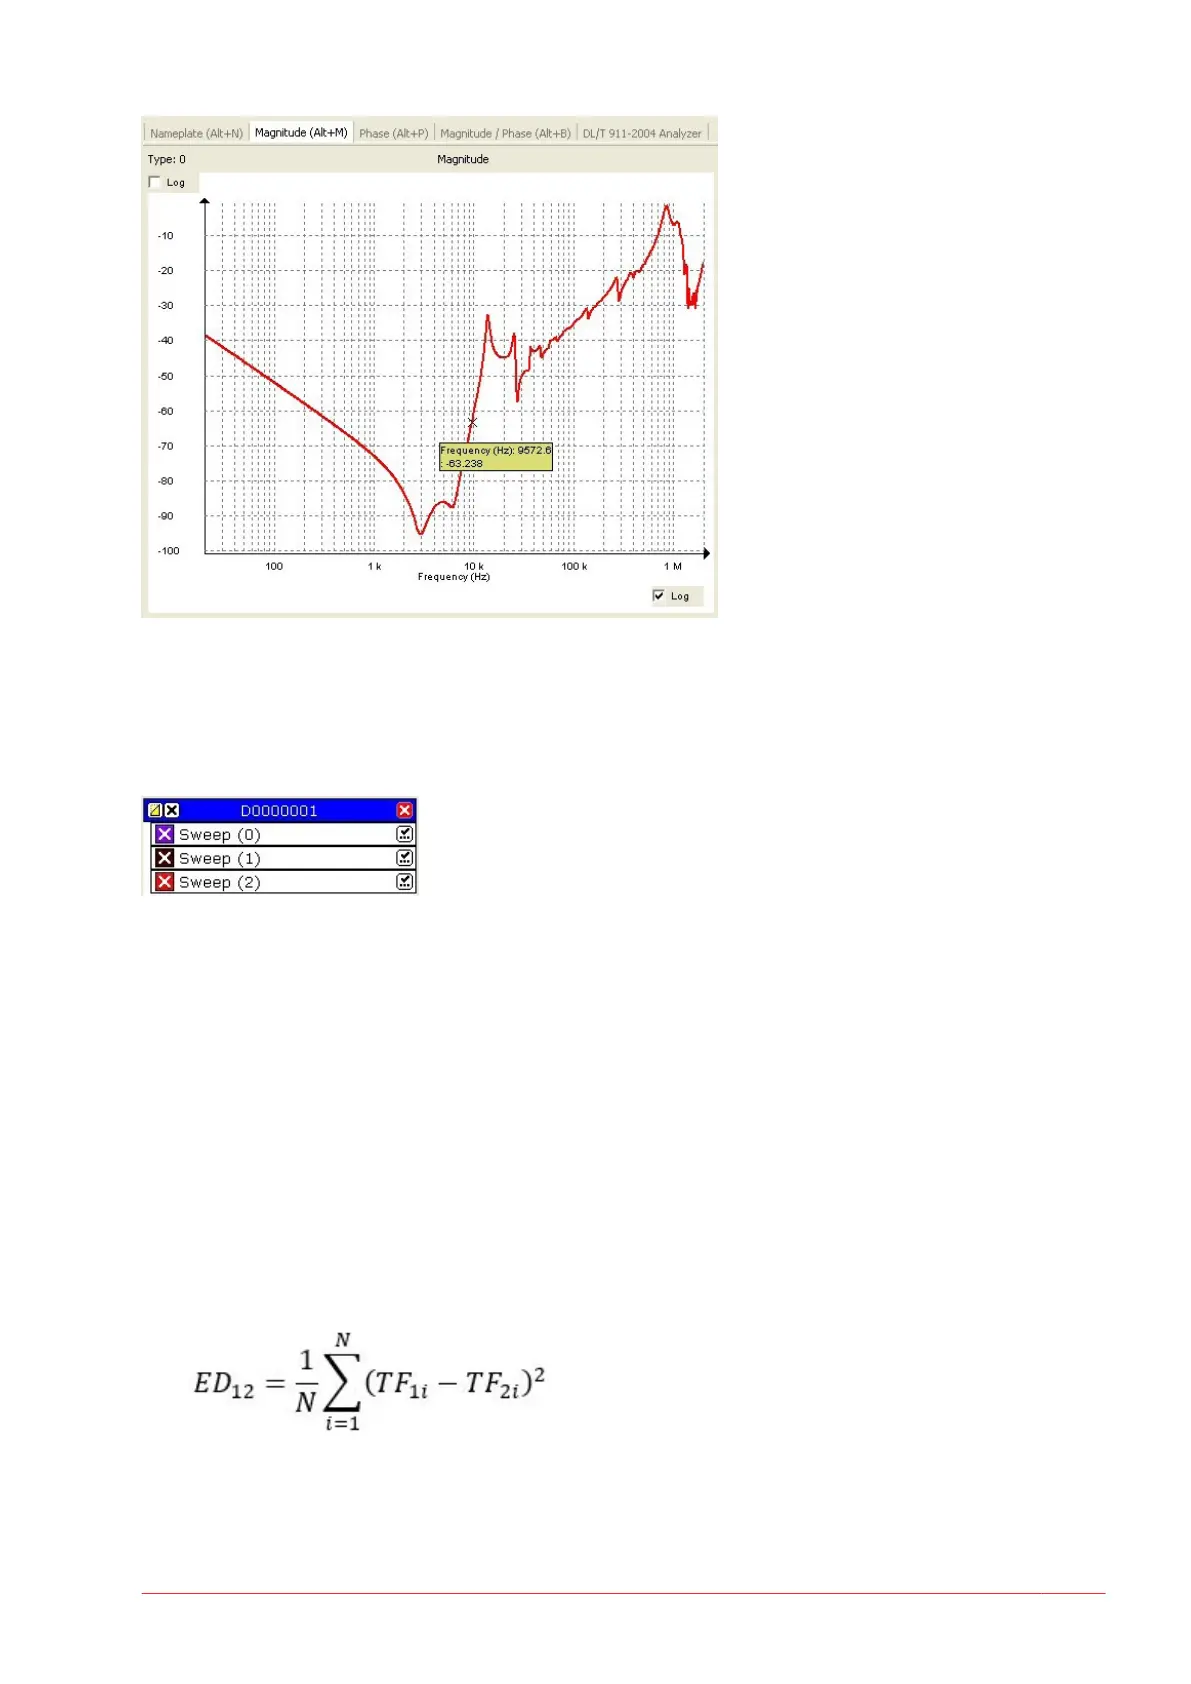
3. NCEPRI algorithm and criteria
The NCEPRI algorithm estimates the correspondence of frequency responses by calculating the eective
deviation (ED) of two transfer functions TF
1
and TF
2
according to the formulae:
where TF
1
and TF
2
are the reference and compared transfer functions or frequency responses.
The DL/T 911-2004 Analyzer is based on the Electric Power Industry Standard of People’s Republic of China,
DL/T 911-2004.
FRAX Software
www.megger.com FRAX-series 51
 Loading...