EasyManuals Logo

Metrix CX 1651 User Manual

Metrix CX 1651
Go to English
176 pages
To Next Page IconTo Next Page
To Previous Page IconTo Previous Page
Page #172 background imageLoading...
Page #172 background image
172
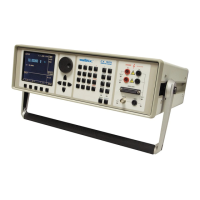
27.1.7. Temperature sensors simulation
temperature scale: ITS 90, PTS 68
types of sensors: RTD, TC
A. RTD (resistance) sensors
types: Pt 1.385, Pt 1.392, Ni
range of R0 setting: 20 to 2 k
temperature range: -200 to +850
o
C
temperature uncertainty: 0.04
o
C to 0.5
o
C (see table below)
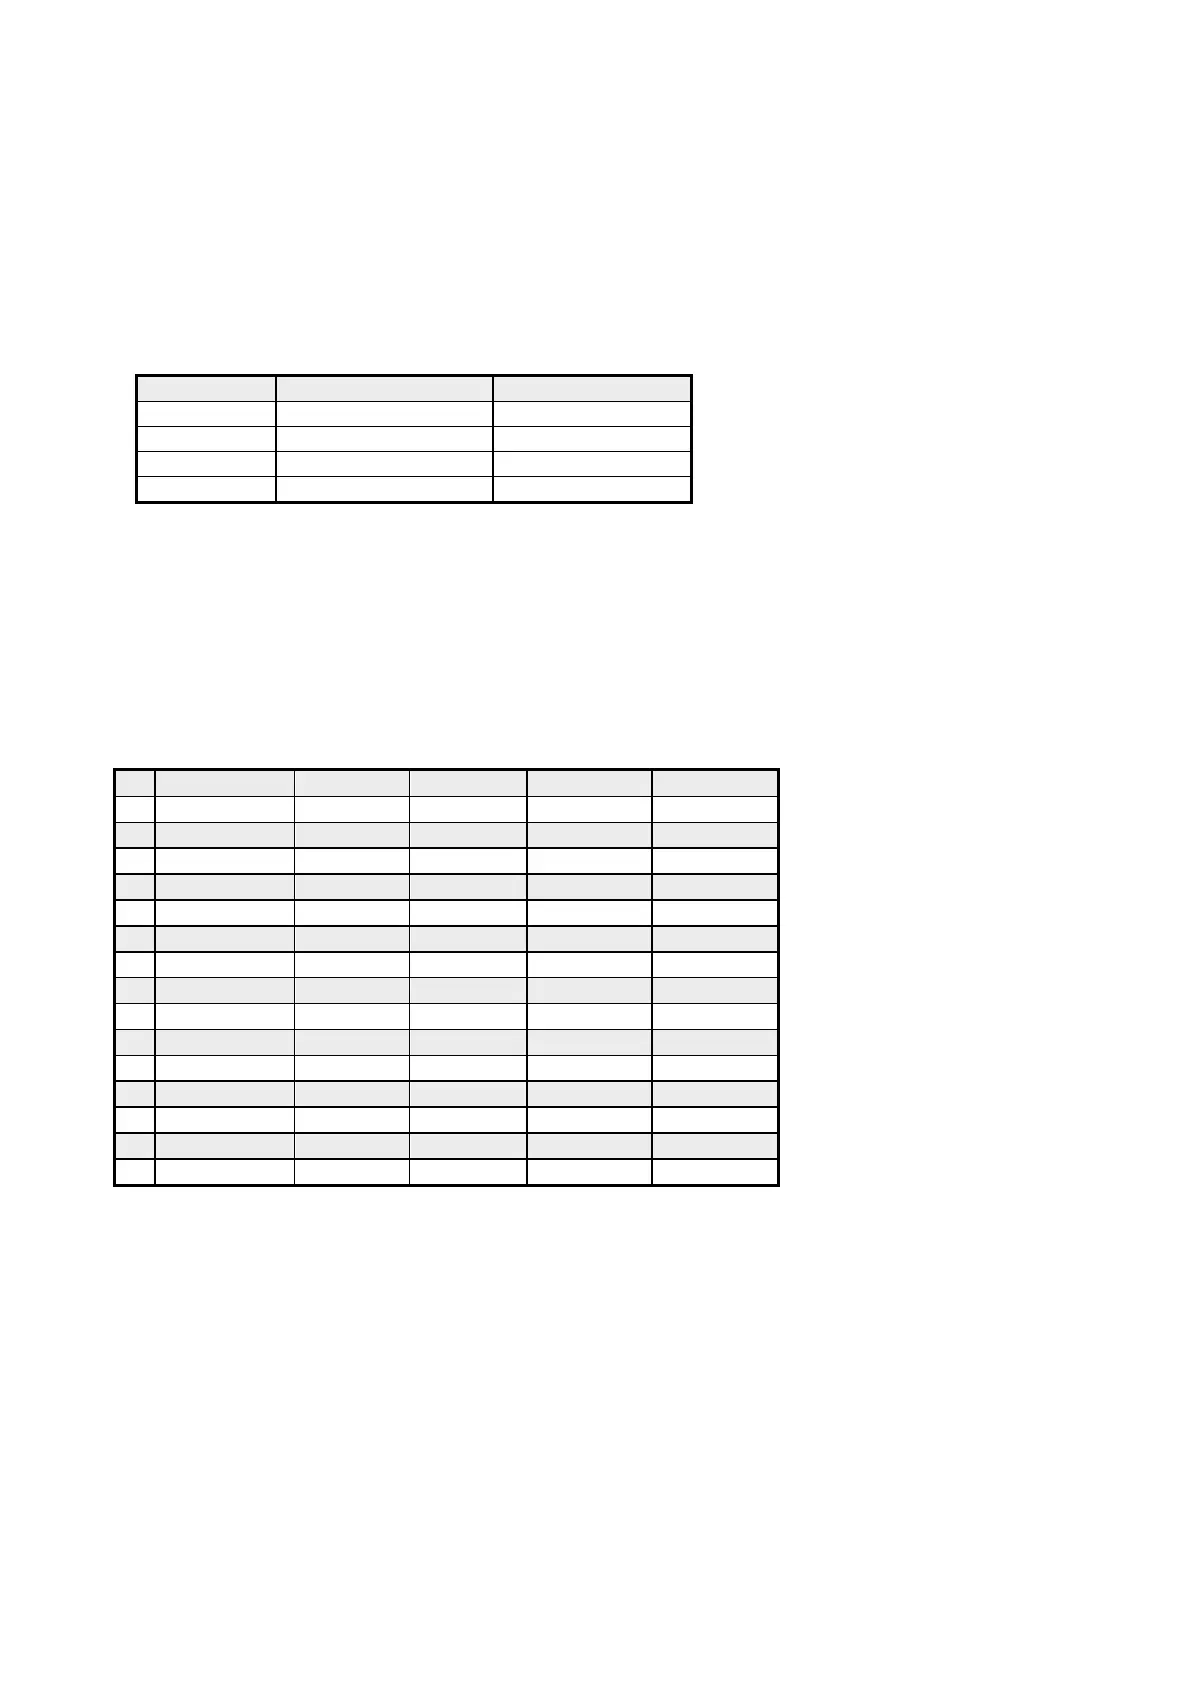
Ranges and uncertainties of RTD sensor simulation
type
range 200 250
o
C
range 250 850
o
C
Pt100
0.1
o
C
0.3
o
C
Pt200
0.1
o
C
0.2
o
C
Pt1000
0.2
o
C
0.4
o
C
Ni100
0.07
o
C
*1
- -
*1
Valid in range 60 to +180
o
C.
Uncertainties in the table are maximal uncertainties of RTD sensor simulation. Actual uncertainty for each set value of
simulated temperature is determined by uncertainty of relevant resistance. Actual temperature uncertainty is displayed on
the calibrator display. Actual uncertainties are always lower than those in above table.
B. TC sensors:
types: K, N, R, S, B, J, T, E
temperature range: -250 to +1820
o
C according to the type
temperature uncertainty: 0.4 to 4.3
o
C (see table below)
Ranges and uncertainties of TC sensor simulation (with function AUTOCAL ON)
R
range [
o
C]
-50 - 0
0 - 400
400 1000
1000 1767
uncertainty [
o
C]
3.2
2.1
1.4
1.7
S
range [
o
C]
-50 - 0
0 - 250
250 1400
1400 1767
uncertainty [
o
C]
2.7
2.1
1.7
2.0
B
range [
o
C]
400 800
800 - 1000
1000 1500
1500 1820
uncertainty [
o
C]
2.8
1.8
1.6
1.8
J
range [
o
C]
-210 - -100
-100 - 150
150 700
700 1200
uncertainty [
o
C]
0.9
0.5
0.6
0.7
T
range [
o
C]
-200 - -100
-100 - 0
0 100
100 400
uncertainty [
o
C]
0.9
0.5
0.4
0.4
E
range [
o
C]
-250 - -100
-100 - 280
280 600
600 1000
uncertainty [
o
C]
1.6
0.4
0.5
0.5
K
range [
o
C]
-200 - -100
-100 - 480
480 1000
1000 1372
uncertainty [
o
C]
1.0
0.6
0.7
0.8
N
range [
o
C]
-200 - -100
-100 - 0
0 580
580 1300
uncertainty [
o
C]
1.2
0.7
0.6
0.8
Uncertainties in the table are maximal uncertainties of TC sensor simulation. Actual uncertainty for each set value of
simulated temperature is determined by uncertainty of relevant resistance. Actual temperature uncertainty is displayed on
the calibrator display. Actual uncertainties are always lower than those in above table.

Table of Contents

Other manuals for Metrix CX 1651

Questions and Answers:

Question and Answer IconNeed help?

Do you have a question about the Metrix CX 1651 and is the answer not in the manual?

Metrix CX 1651 Specifications

General IconGeneral
BrandMetrix
ModelCX 1651
CategoryTest Equipment
LanguageEnglish

Related product manuals