4: Data Logging & Communications (U4000)
32 U3000/U4000 User Manual
(Issue 2.0)
Monitoring the logged events as a table
1. The VIEW LOG AS TEXT screen displays
the log events in date-stamped
chronological order.
Press key 5 to go to the top line of logged
data or key 6 to go to the bottom line.
2. Press the ENTER key to return to the REAL
TIME LOGGER screen. Then select Exit
to return to the FLOW READING screen.
Logging will continue to take place in the
background.
Monitoring the logged events as a graphic
1. If you want to view the logging progress
graphically rather than as text, press the
Logger function key to get to the REAL
TIME LOGGER screen.
2. Select Graph Y axis max and enter a
value slightly greater than the expected
maximum flow.
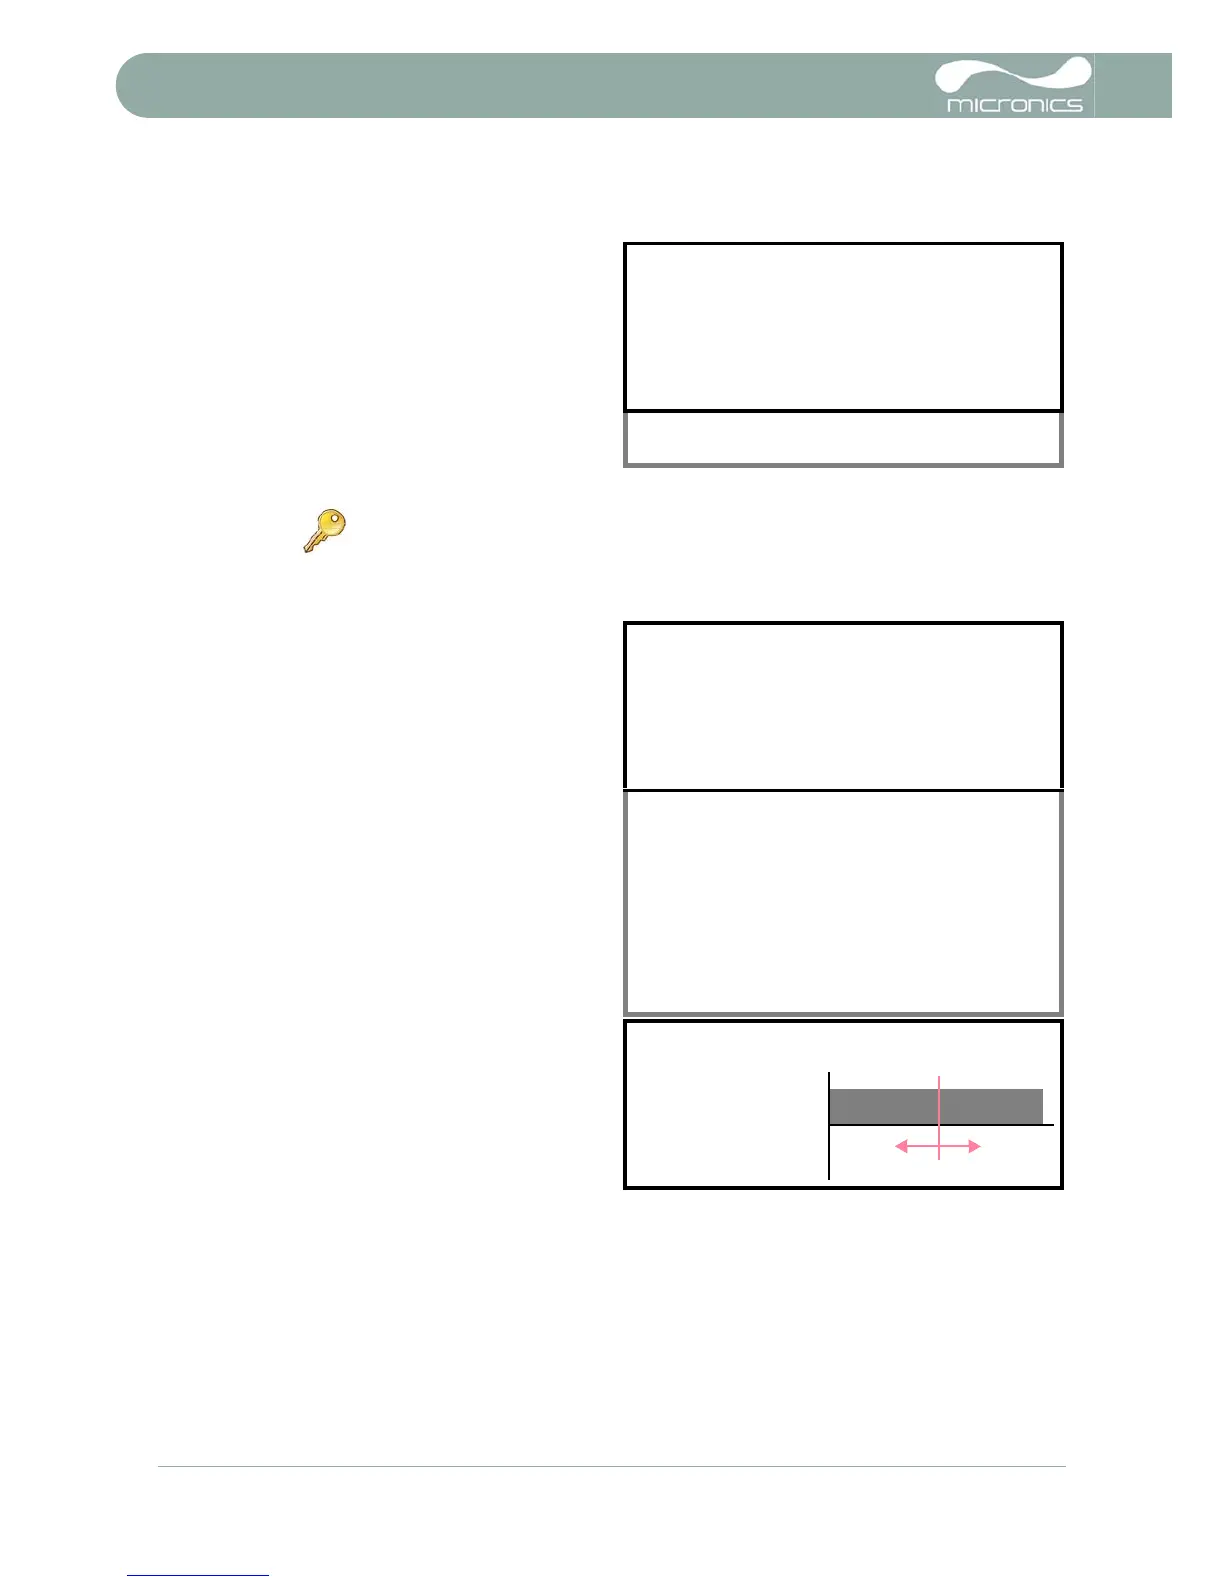
3. Select View log as graph. This will
open the VIEW LOG AS GRAPH screen
shown below.
4. You can select the data at any point in time
by scrolling along the time axis of the graph
using the LEFT/RIGHT scroll keys (5 & 6).
The data values for the selected point are
then shown to the left of the graph. Keep
the scroll key pressed for the cursor to
move automatically.
5. If you want to change the value of the Y
axis to improve the resolution of the graph
press the UP/DOWN scroll keys. The
maximum values will then increase/
decrease as appropriate.
6. To exit the VIEW LOG AS GRAPH screen
and return to the REAL TIME LOGGER
screen press ENTER.
Monitoring the logged events at a later time
If you wish to monitor the logging progress at any time while you are operating in FLOW READING mode
without interfering with the logging operation:
1. Press the Logger function key as described above to switch to the REAL TIME LOGGER screen.
2. Select View log as text or View log as graph, as required.
Key Point: There can be only one set of logged data per site. If a new data log
is started on a site it will clear the existing data.
VIEW LOG AS TEXT DD-MM-YY HH:MM:SS
Logging to memory Dim: mm
Log:Quickstart
Date Time Flow
DD-MM-YY hh:mm:ss xxx.xx l/m
DD-MM-YY hh:mm:ss xxx.xx l/m
DD-MM-YY hh:mm:ss xxx.xx l/m
DD-MM-YY hh:mm:ss xxx.xx l/m
--------
DD-MM-YY hh:mm:ss xxx.xx l/m
REAL TIME LOGGER DD-MM-YY HH:MM:SS
Logging to Memory Dim: mm
Unit : l/min
Log name : Quickstart
Log data to : Memory
Logging interval : 10 seconds
Start date & time : dd-mm-yy hh:mm:ss
Stop date & time : dd-mm-yy hh:mm:ss
MM DD HH MM SS
Remaining time : mm dd hh mm ss
Memory Rollover : Overwrite
Graph Y axis max. : 50
Log Totals : +Total
View log as text
View log as graph
START NOW
Set Auto start
Clear log
Exit