VS 8/VS 8A Vital Signs Monitor Operator’s Manual 12 - 11
12.3.1 The Pain Score Display
The following figure shows the pain score screen. Your display may be configured to look
different.
12.3.2 Performing Pain Score
Follow this procedure:
1. Swipe on the Pain Score screen to the left or right to select a pain scale.
2. Set the pain description if needed.
3. Tap the scoring area to select a value or an option for scoring.
4. Select the Save quick key to save the data.
12.4 Targeted Goal
For patients under continuous monitoring, if you are concerned with specific parameters
and their trends, you can use the Targeted Goal screen. The Targeted Goal screen
focuses on the target parameter and displays parameter measurements in big numerics.
You can easily identify whether parameter target is reached via a dashboard and review
the statistics of the target parameter by sections.
The Targeted Goal screen displays parameter measurements and waveforms of SpO
2
,
PI, PR, NIBP, and Temp. The measurements of these parameters displays in big numerics.
12.4.1 Entering the Targeted Goal Screen
To enter the Targeted Goal screen, in Continuous Monitoring mode, select Ta rgeted
Goal quick key.
(1) The name of currently used pain scale
(2) Scoring area: selecting this area to select a value or an option from the popup list for
total scoring.
(3) Indicating the number of pain scales currently selectable
(4) Adding pain description
12 - 12 VS 8/VS 8A Vital Signs Monitor Operator’s Manual
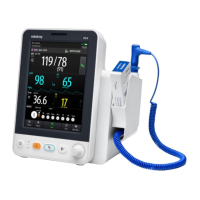
12.4.2 The Display of the Targeted Goal Screen
12.4.3 Operating the Targeted Goal Screen
You can access parameter setup and trends review from the Targeted Goal screen.
■ Select the parameter trends area to enter the Tabular Trends review page.
■ Select the target parameter statistics area to enter the parameter statistics setup
menu. Set the range of each section and the target section.
■ Select the desired waveform area, parameter numeric area, or dashboard to enter
corresponding parameter setup menu.
(1) Target parameter area: displays the SpO
2
measurement in big numerics, as well as
its target range, and alarm limits.
• The dashboard shows the target range in green.
•The △ pointer below the dashboard indicates the current measurement value.
(2) Target parameter waveform area: displays the SpO
2
waveform.
(3) Target parameter statistics area: displays the SpO
2
statistics by sections.
(4) Parameter trends area: displays trends of the target parameter and secondary
parameters.
(5) Other parameter area: displays parameter measurements and alarm limits of
parameters other than the target parameter and secondary parameters.
(6) Secondary parameters area: displays parameter measurement of PR and PI in big
numerics, as well as parameter sources and alarm limits.
To Purchase, Visit Avobus.com or call 1-800-674-3655