EDS-510A Series User’s Manual Featured Functions
3-89
Using Monitor
You can monitor statistics in real time from the EDS-510A’s web console and serial console.
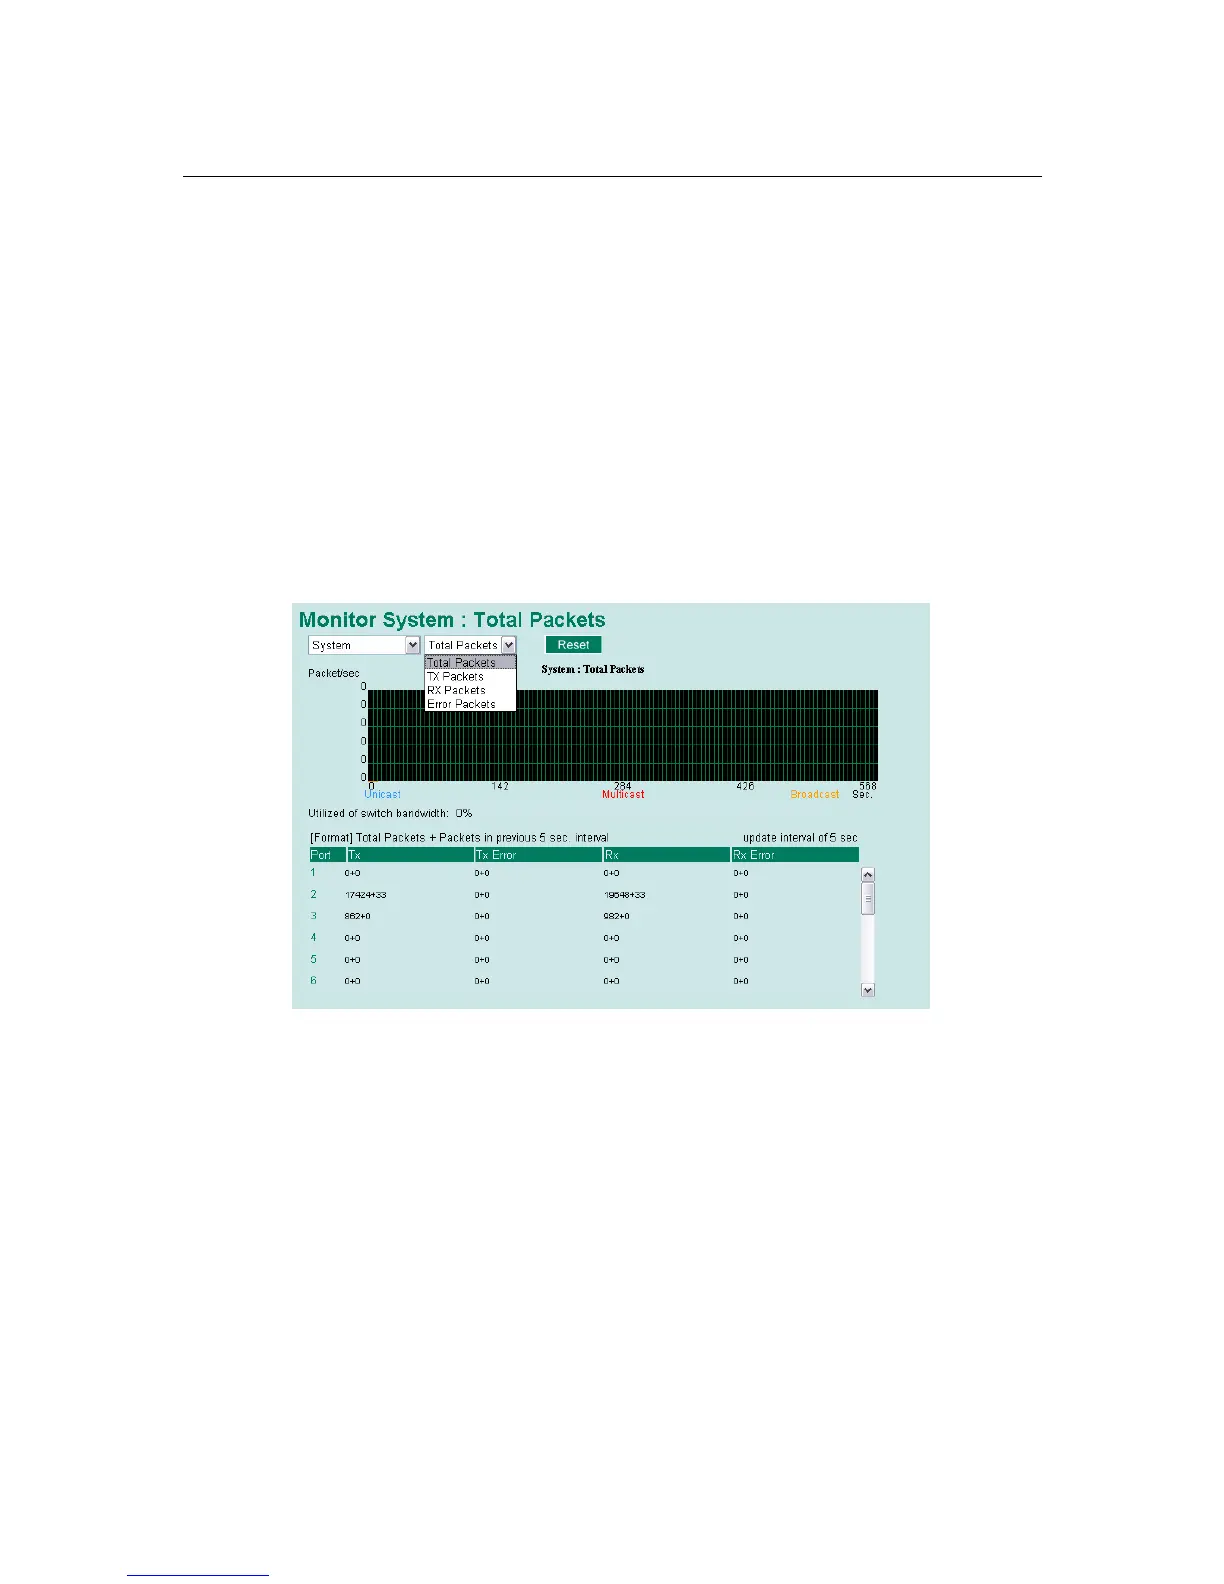
Monitor by Switch
Access the Monitor by selecting “System” from the left selection bar. Monitor by System allows
the user to view a graph that shows the combined data transmission activity of all the EDS-510A’s
18 ports. Click one of the four options—Total Packets, TX Packets, RX Packets, or Error
Packets—to view transmission activity of specific types of packets. Recall that TX Packets are
packets sent out from the EDS-510A, RX Packets are packets received from connected devices,
and Error Packets are packets that did not pass TCP/IP’s error checking algorithm. The Total
Packets option displays a graph that combines TX, RX, and TX Error, RX Error Packets activity.
The graph displays data transmission activity by showing Packets/s (i.e., packets per second, or
pps) versus sec. (seconds). In fact, three curves are displayed on the same graph: Unicast packets
(in red color), Multicast packets (in green color), and Broadcast packets (in blue color). The
graph is updated every few seconds, allowing the user to analyze data transmission activity in
real-time.

 Loading...