© Munters AB, 2020 79
•
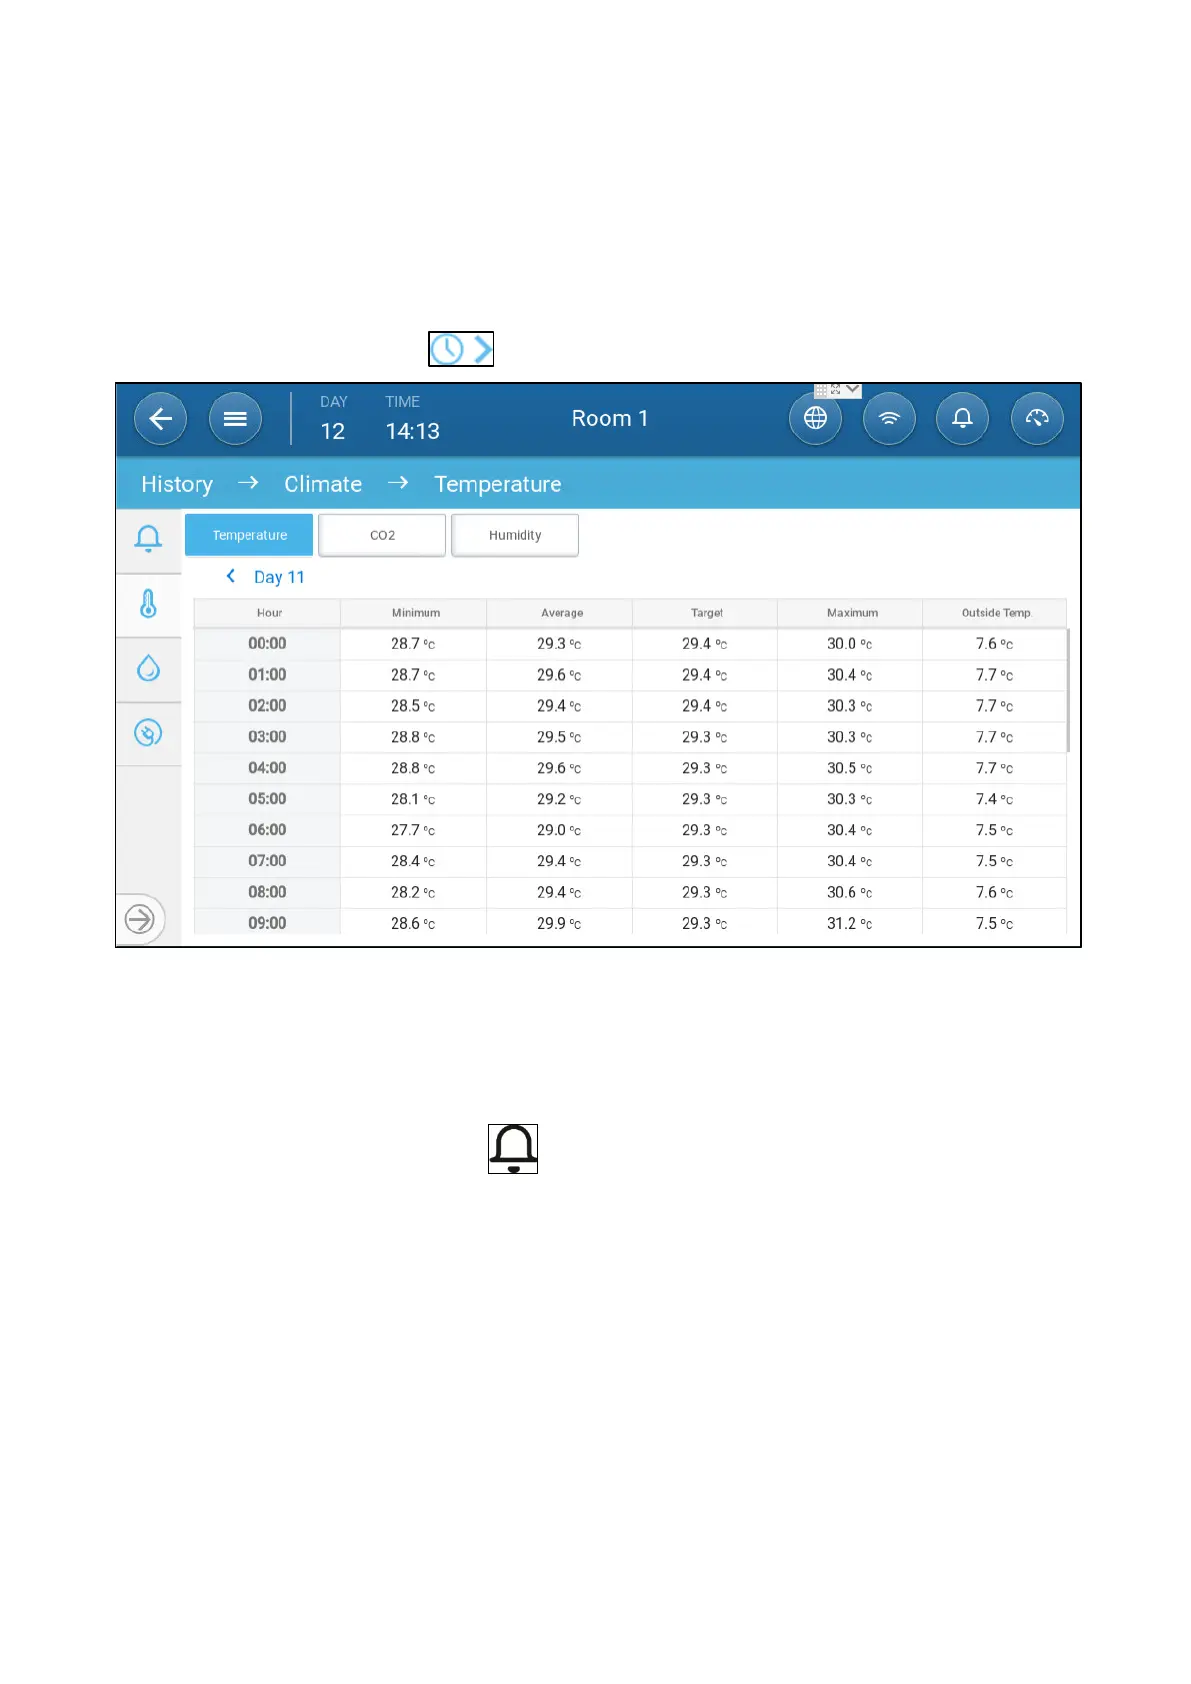
Humidity History: Records the average, minimum and maximum humidity for each growth day
every hour.
•
Co2 History: Records the average, minimum and maximum Co2 for each growth day every
hour.
•
Ammonia History: Records the average, minimum and maximum ammonia for each growth day
every hour.
•
Click the clock symbol ( ) to view the hourly breakdown.
16.2
Alarms and Events
Go to this screen to view the last 999 alarms and events. Alarms history can display the following alarms.
NOTE Performing a Cold Start or Starting a new group clears the Alarm History.
1. Go to Batch > History > Alarms .
2. Click the relevant tab.
 Loading...