33
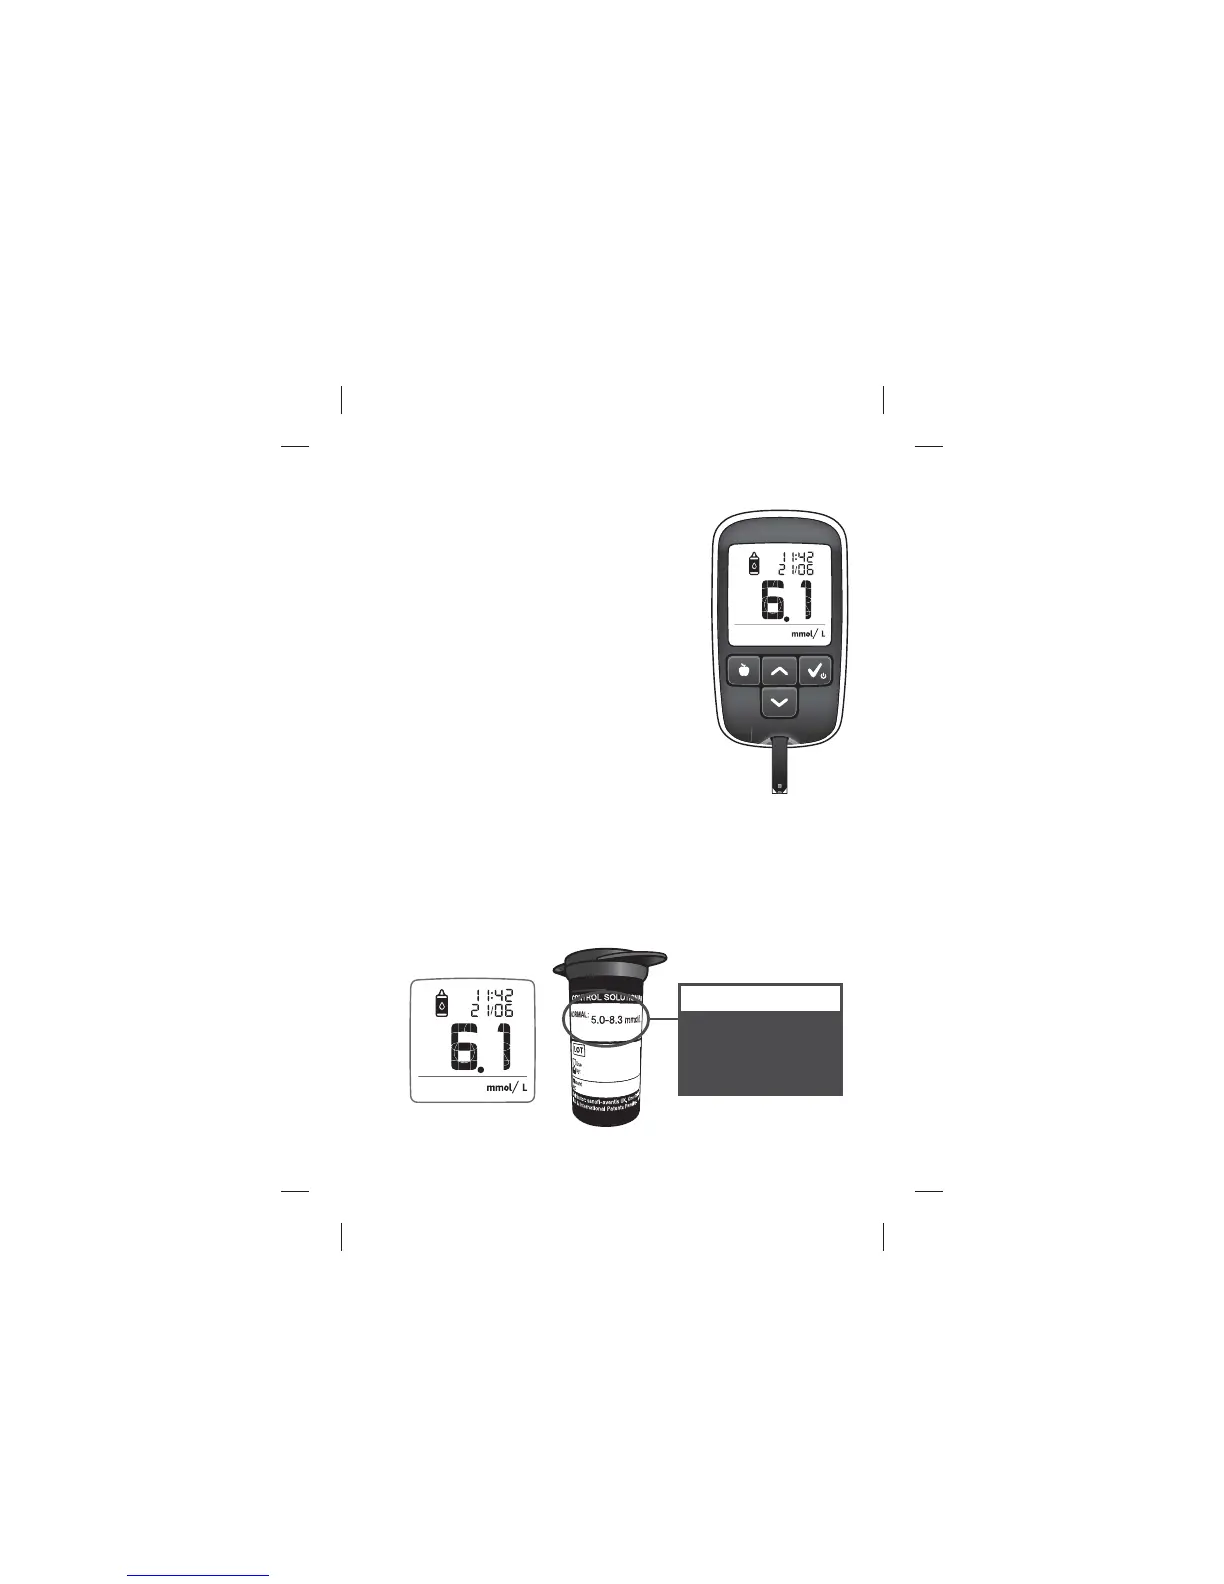
[5] View Control Solution Test Result
The control solution test result will appear
on the meter display. The date, time and
control solution icons will also appear on
the display. The control solution test result
is stored in the memory of your meter
but is not included in Averages or ~A1c
calculations.
[6] Check if Result Is in Range
Compare the result of your control solution test to the range prin-
ted on your BGStar® Test Strip vial label. Your control solution result
should fall within this range.
Normal: 5.0-8.3 mmol/L
FOR EXAMPLE ONLY.
Refer to your test strip vial
label for corresponding
range.
Performing a Control Solution Test
Example:
Example: