21
GRAPHIC DIVER INTERFACE
™
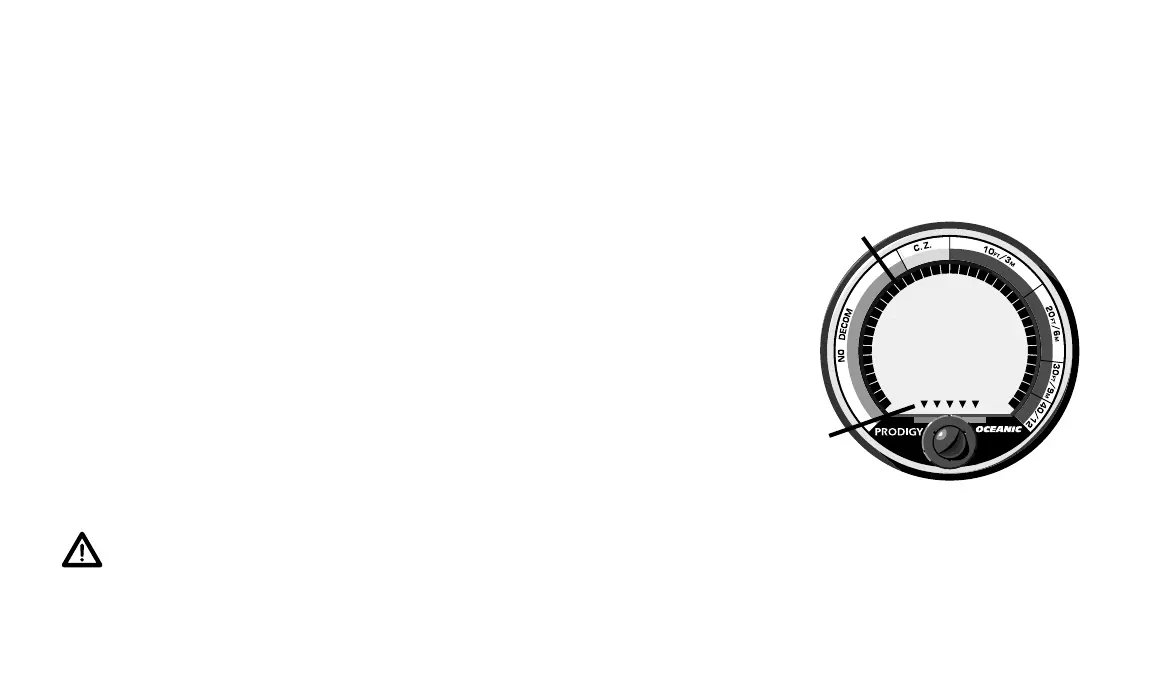
Two different bar graphs are located around the perimeter of the
PRODIGY LCD (Fig. 18). They are color coded green, yellow, and red to
denote normal, caution and danger zones, respectively. The Graphic Diver
Interface allows you to make quick status checks underwater of your no-
decompression status and ascent rate. By keeping these bar graphs “in the
green” at all times, you'll greatly reduce your exposure to decompression
sickness. A detailed description of each graph follows.
Tissue Loading Bar Graph (TLBG)
The semicircular graph found on the perimeter of the display is the TLBG
(Fig. 18a). It monitors twelve different tissue compartments simultaneously
and displays the one that is highest. The TLBG is divided into three main
sections; green no decompression (No Decom) zone, yellow caution zone
(C.Z.), and red decompression zone. The red decompression zone is further
divided into four decompression “ceiling” zones of 10, 20, 30, and 40 feet (3, 6,
9, and 12 meters). By referring to the TLBG, you can see a visual representa-
tion of nitrogen absorption and use it to help avoid or, if necessary, manage
decompression.
WARNING - Oceanic advocates responsible diving practices and
does not recommend decompression diving or diving below 130 feet
(40 meters).
b.
Fig. 18 – Graphic Diver Inter-
face
®
a.