4
®
FT
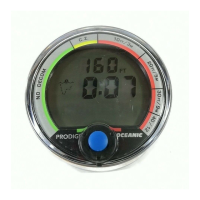
USING THE “GRAPHIC DIVER INTERFACE”
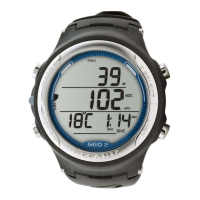
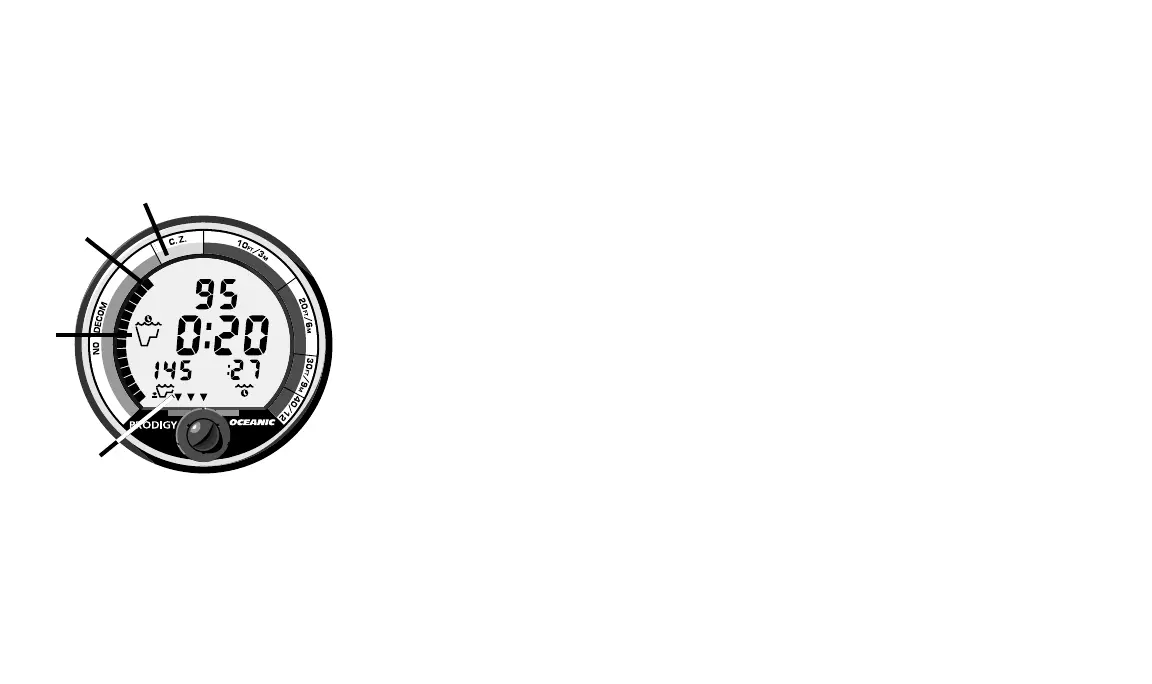
To make it easy to check your dive status on the PRODIGY, a color-coded
system of graphic displays is used. This “Graphic Diver Interface” is made up
of two bar graphs that have green, yellow and red markers to indicate nor-
mal, caution, and danger zones, respectively. The two graphic displays
represent ascent rate and nitrogen loading.
When underwater, you can make quick status checks by glancing at the
two bar graphs and making sure that they are “in the green.” With one
quick glance you can make sure you’re not getting too close to the no-decom-
pression limit or ascending too fast.
ASCENDING TO THE SURFACE
A graphic representation of nitrogen absorption can be seen in the
“Tissue Loading Bar Graph” (Fig 3b). This green, yellow, red bar graph
shows how close you are to the no-decompression limit. It “fills–up” with
segments as your depth and bottom time increase, simulating the absorption
of nitrogen. Upon ascent to shallower depths, the Tissue Loading Bar Graph
(TLBG) will begin to recede giving a visual representation of nitrogen off–
gassing. The TLBG also provides a way to easily manage decompression by
indicating four red “ceiling” depths. This is discussed fully in the “Handling
the Extremes” section beginning on page 27.
Fig. 3 – No-decompression
Dive Mode
a.
b.
c.
d.