115
Advanced Functions
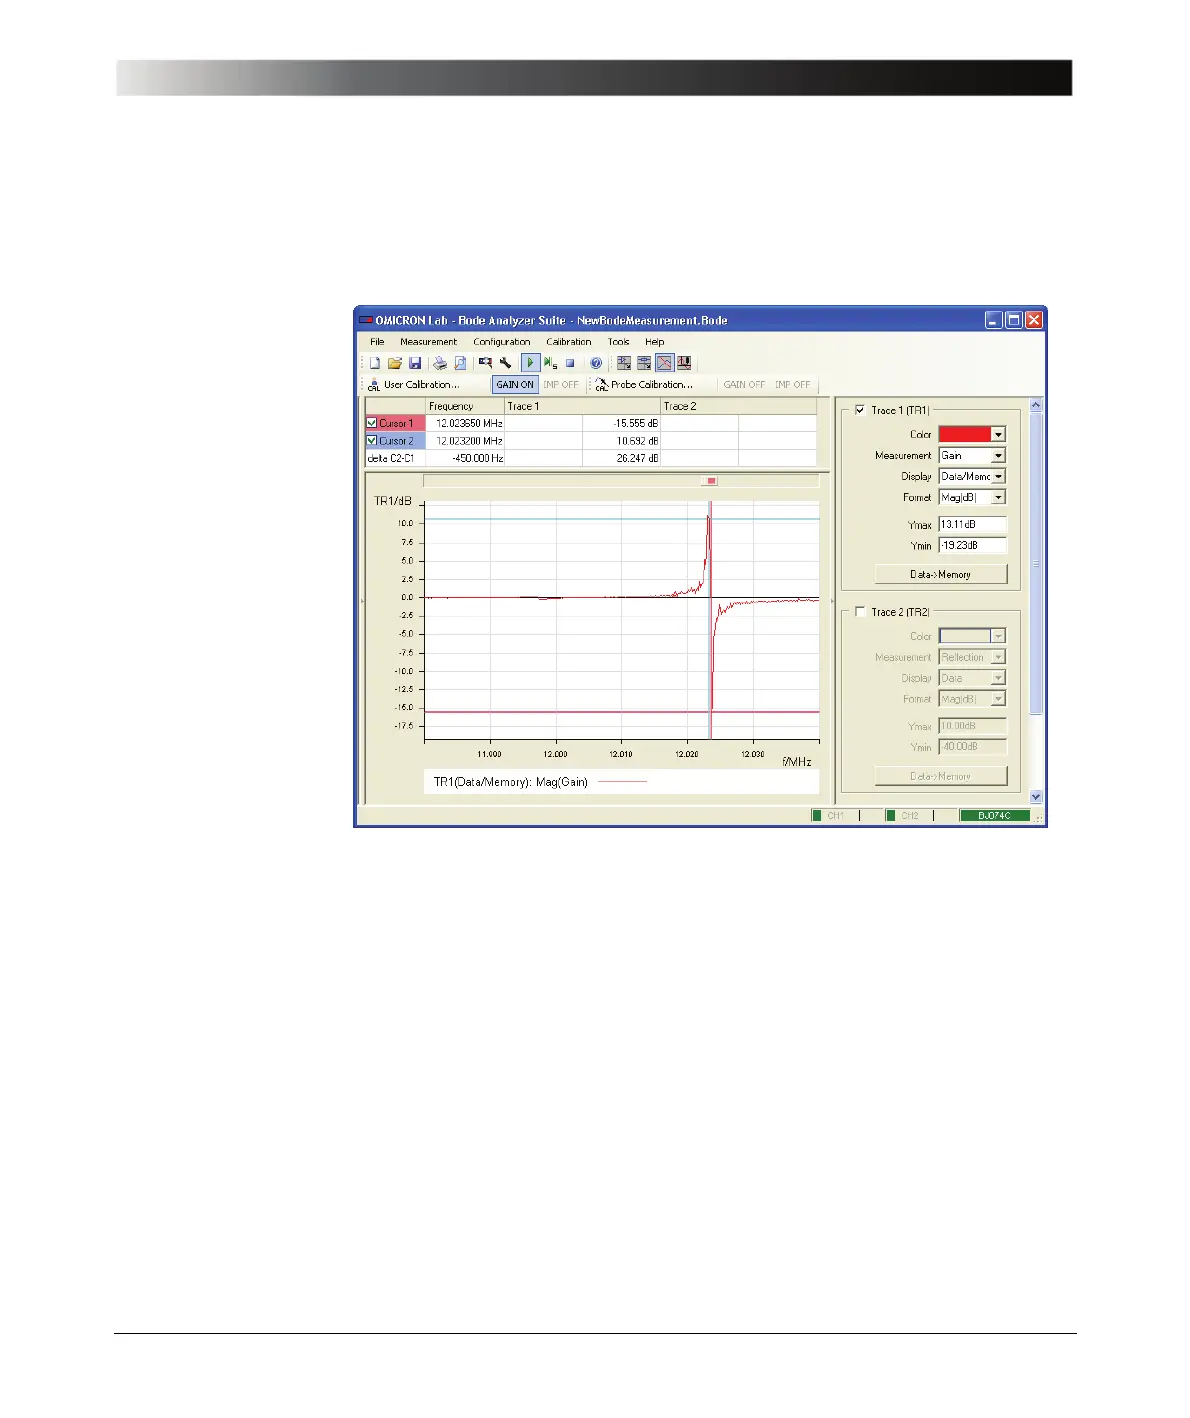
9. Optimize the Y-axis.
The diagram now displays the difference between the actual measurement
data and the stored data.
If the curve is above the 0 dB line the current measured data is higher than the
stored measurement data. If the curve is below the 0 dB line the currently
measured data is lower than the stored measurement data.
Hint: The Data/Memory function allows you to detect even smallest differences
between different parameters of the same component type (e.g. comparison of
two quartz filters of the same type).
Congratulation! You learned how to use the data and memory functions in the
Frequency Sweep mode.
How to:
• Copy the current measurement data to the trace memory
• Compare the frequency responses
• Detect even smallest differences between the current and stored
measurement data by using the Data/Memory display function