Bode 100 User Manual
46
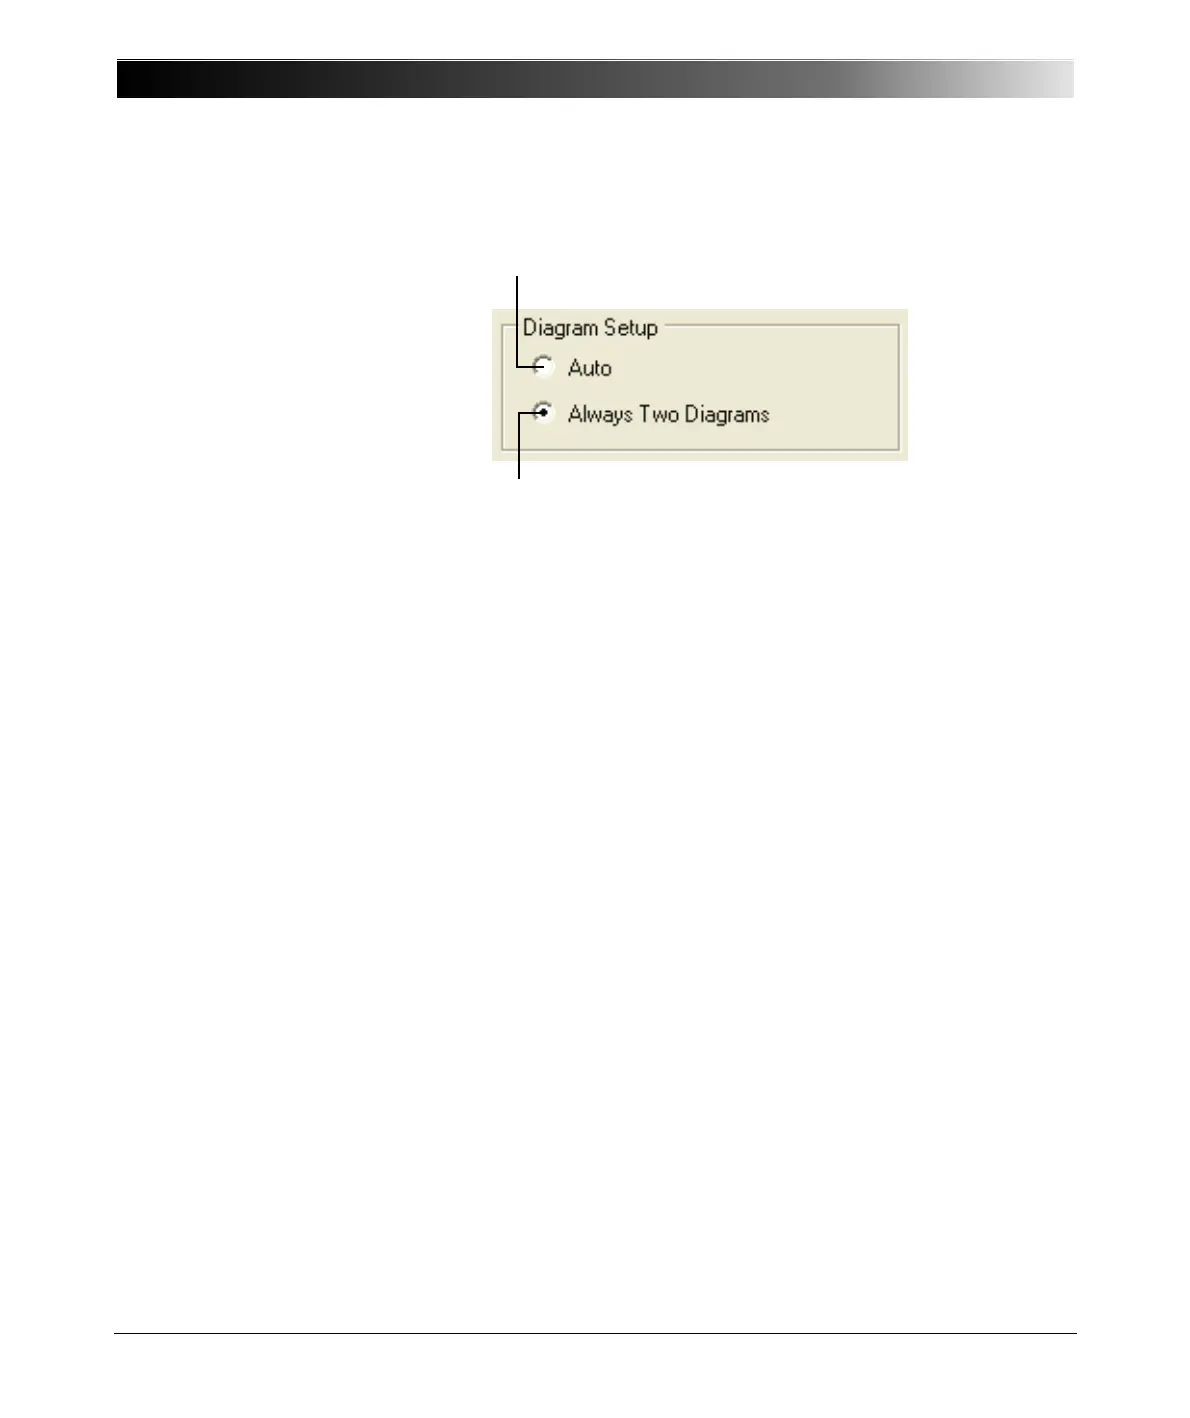
Figure 5-5:
Diagram setup
Note: Diagram Setup is only available if both traces are activated.
5.1 Example: Frequency Sweep Measurement
Expected example duration: 30 minutes.
In this example you will learn step by step how to use the Frequency Sweep
mode of the Bode 100.
How to:
• Visualize measurement data in a graph
• Set configuration parameters like the input resistor and bandwidth
• Set sweep parameters like start and stop frequencies
• Use cursors to read single measurement points
• Calibrate and compensate the cables
Click Auto to display both traces
in one diagram, if possible.
Click Always Two Diagrams
to display the traces in two
separate diagrams.