92
Step 1: Evaluating the Configuration with Graphs Section 3-4
3-4 Step 1: Evaluating the Configuration with Graphs
There is a voltage drop in a communications cable as current flows through
the cable. The voltage drop increases in proportion to the length of the com-
munications cable and the amperage of the current being carried.
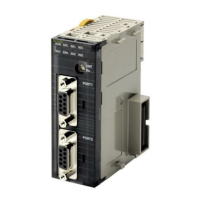
The communications power supply at each node must be 11 V DC min. The
following graph shows the maximum current that can be supplied through var-
ious lengths of cable while maintaining the minimum voltage required at the
nodes. (The values in the graph provide some extra margin.)
Thick Cable
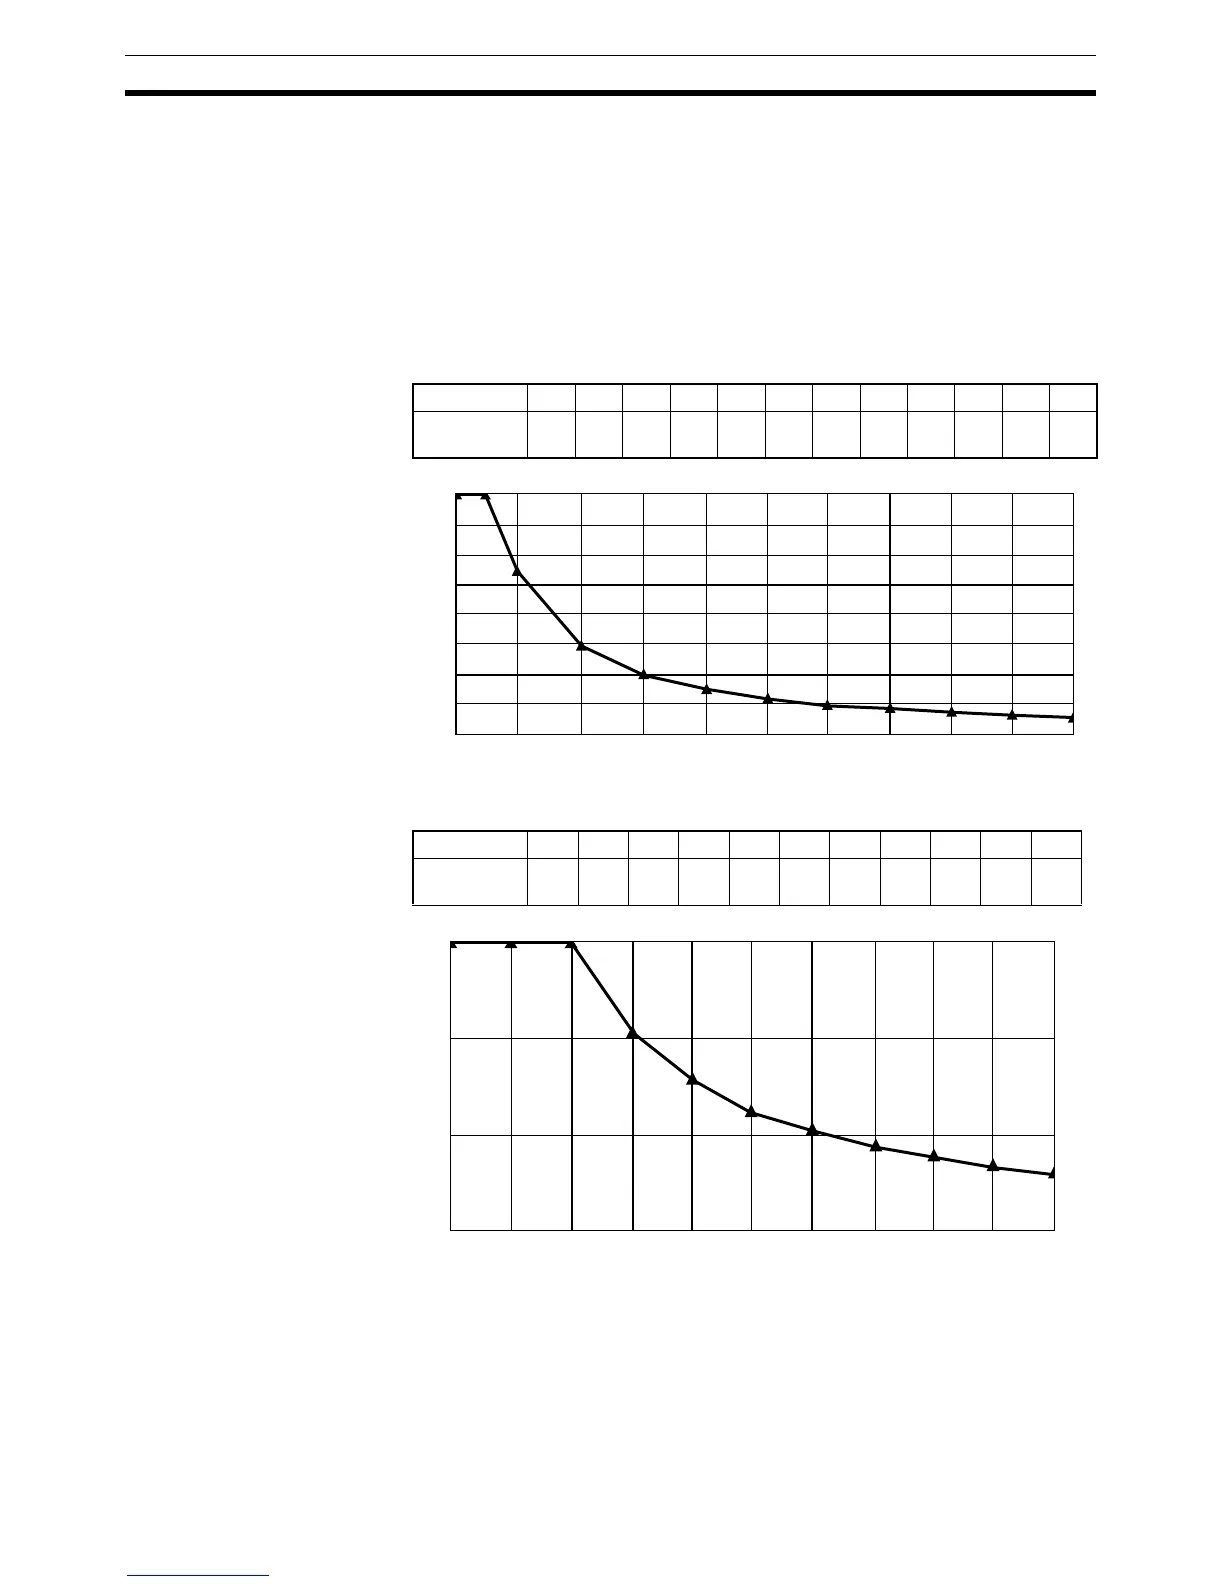
Thin Cable
Distance (m) 0 25 50 100 150 200 250 300 350 400 450 500
Maximum
current (A)
8.00 8.00 5.42 2.93 2.01 1.53 1.23 1.03 0.89 0.78 0.69 0.63
Distance (m) 0 10 20 30 40 50 60 70 80 90 100
Maximum
current (A)
3.00 3.00 3.00 2.06 1.57 1.26 1.06 0.91 0.80 0.71 0.64
8
7
6
5
4
3
2
1
0
0 50 100 150 200 220 300 350 400 450 500
Maximum current (A)
Distance (m)
3
2
1
0
0102030405060 708090 100
Maximum current (A)
Distance (m)