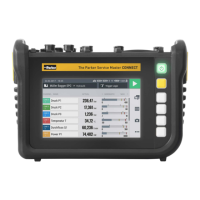
6.3.3 Trend Graph View
The trend graph view can display up to 4 channels in the form of trend curves
on a graph. The trend graph view displays the current measured values.
If more than 4 channels are active, you can scroll through the list horizontally.
1 Tap on a channel from the list to select the channel.
Ä The line of the corresponding channel is displayed in bold print.
INFORMATION
Save the measurement to analyze the measured values.
Refer to Chapter &„Analyzing the Measurements“ on Page61.
4
Fig.21 Trend graph view
Pos. Description
1 Name of the channel
2 Selected channel (increased line thickness)
3 Current measured value of the channel
4 Trend graph line of the selected channel
40
The Parker Service Master COMPACT V1.0/02/24
Operation