© 2021 Radiodetection Ltd 28
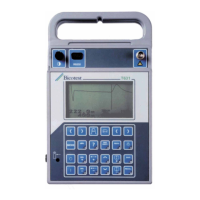
Fig. 7.4: Looped system 1
Fig. 7.5: Looped system 2
Taking Measurements
– Distribution Systems
Below are some typical results, which can be found from
using the PCMx for CP system diagnosis on a distribution
system.
Good local knowledge and a map of the pipe network
are essential to determine suitable positions to connect
the PCM transmitter and where to take readings. It is
worthwhile taking measurements over the complete site
before concentrating on any particular area.
The following diagram is a typical street involving ‘Tie-ins’
and an ‘L’. The readings from the PCMx and distances to
prevent interference have been included. By working
around the map a short was quickly and easily detected.
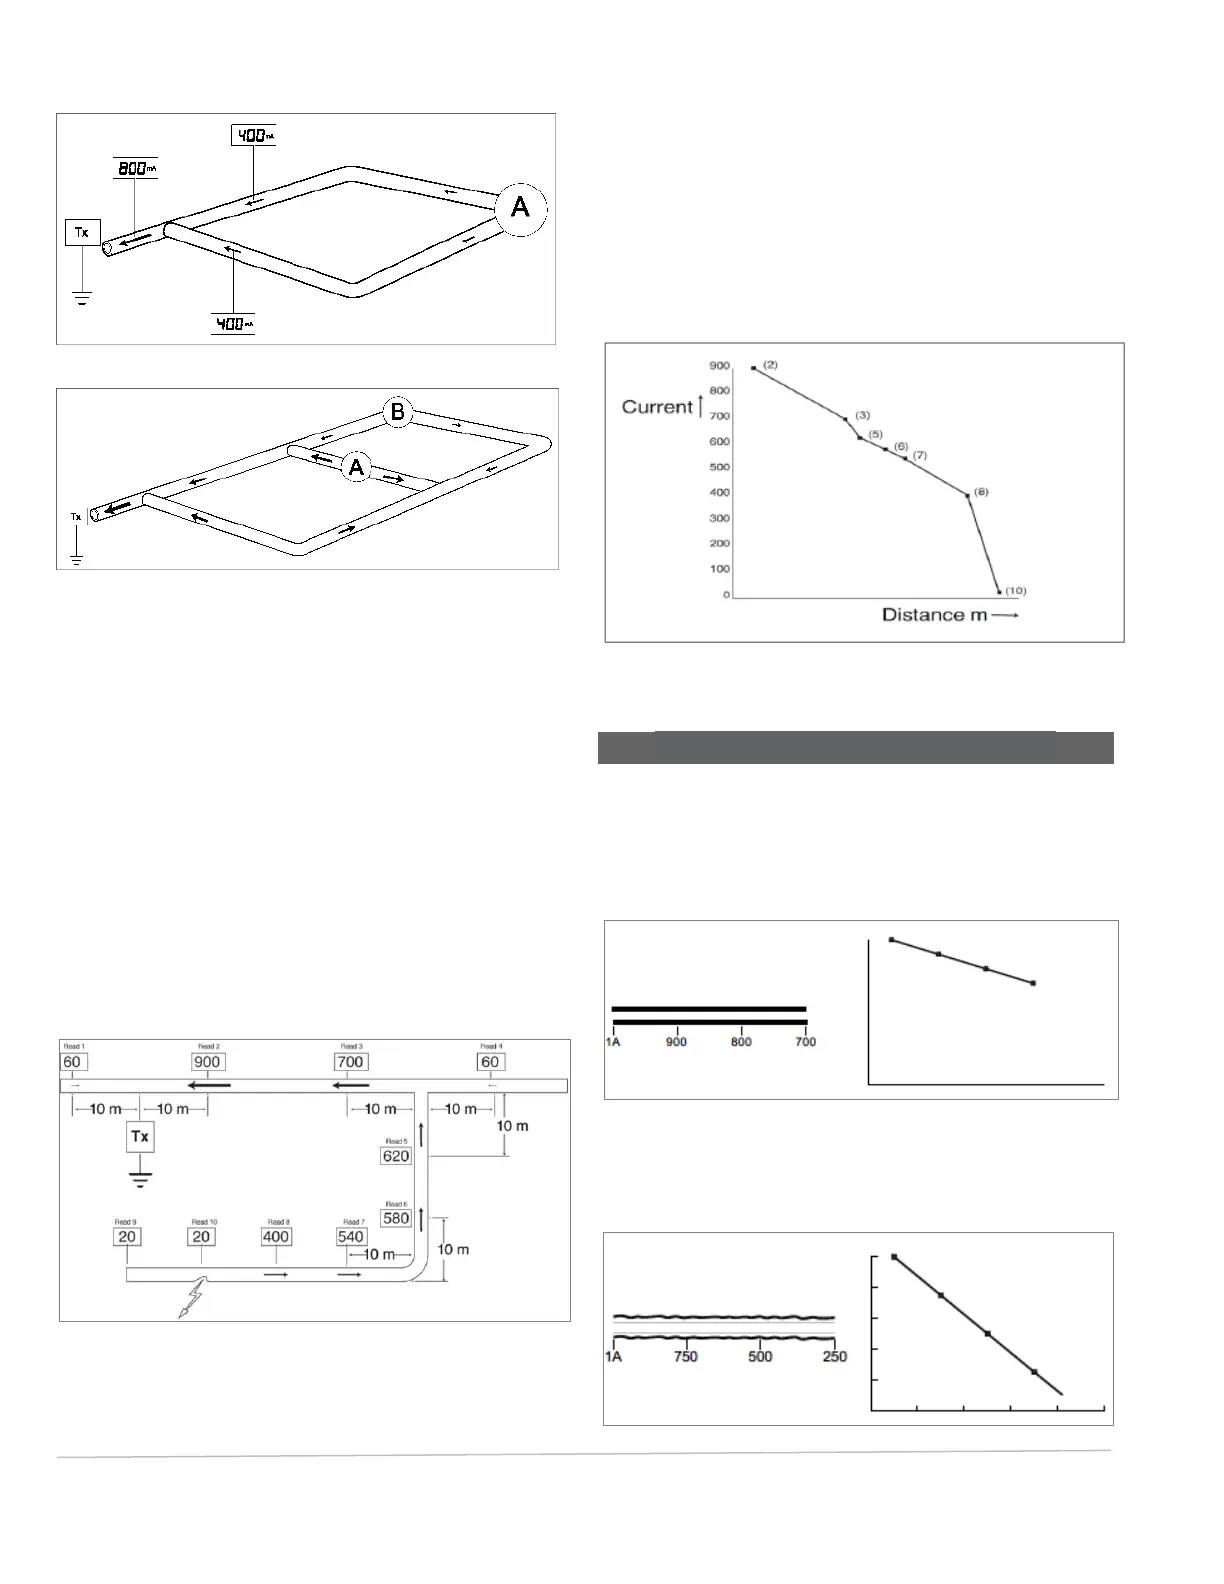
Fig. 7.6: Distributed system
In this example measurements were taken at key areas to
determine direction of major current flow.
Read 2 indicated initial direction to follow.
Read 5 indicated which section on tie-in to follow.
Read 9 indicated that the short had been passed and was
between Read 9 and Read 8.
Short found by dividing the distance between a good and
bad read until located.
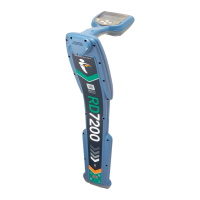
Fig. 7.7: Interpreting distributed systems
7.2
Pipelines and Pipeline defects
Interpretation of Readings and Graphs
Pipe coating in good condition is shown as very little loss
of current.
Pipe coating in poor condition is shown as a rapid loss of
current.