© 2021 Radiodetection Ltd 34
In practice, the results obtained require some interpretation
because sometimes the magnetic field detected from the
pipe may be affected by other signal paths in the ground,
including around the position of coating defects.
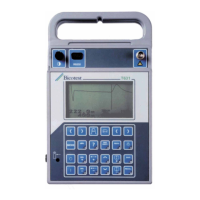
Fig. 8.1: Interpreting results
Figure 8.1 Graph ‘B’ shows the theoretical effects of the
fault current in the ground. Note that the local fault current
enters the pipe from both directions and this distorts the
magnetic field around the pipeline close to the fault. A
short distance from the fault the ground currents subtract
from the pipe current, which is measured as current
reduction. A short distance after the fault they add to the
pipe current, which is measured as current increase. At
some distance from the fault, current settles to a steady
state.
If this local effect is observed, it is useful for detecting
defects.
Figure 8.1 Graph ‘C’ shows what would be expected in the
real situation if PCMx currents were plotted over a section
of pipe with a coating defect.
Depending on the fault characteristics, the effect of the
magnetic field distortion will spread over a distance of
perhaps 2 to 10 meters either side of the fault, and the effect
will vary depending on the type and severity of the fault.
A fault caused by the surveyed pipeline being in contact
with another structure, such as another pipe or cable
running across the pipeline, will show some distortion of
the magnetic field directly over the contact, but is unlikely
to show the rise in current after the fault.
These effects are more noticeable when the survey is
performed over a short distance either side of a fault.
This highlights the need to perform surveys over a
complete section before attempting a more detailed
survey of suspect areas.
8.7 Using dBmA for Pipeline Current
Mapping
The PCMx locator displays current as mA, and also
saves the data logs in mA. When the datalogs are
uploaded to the PCM Manager application the datalogs
can displayed and saved to file as either mA or dBmA.
Please refer to the PCM Manager operation manual for
details.
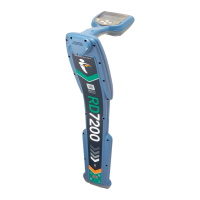
The AC signal current applied to a coated pipeline in
perfect condition will be lost by capacitance as distance
increases from the point where the signal is applied. The
PCMx uses near DC signal (4Hz) for current
measurement, so capacitive losses are minimal. The
resulting graph drawn using mA will have an exponential
slope, because there is a greater current loss rate close
to the transmitter. See Fig. 8.2
Fig. 8.2: mA fault graph
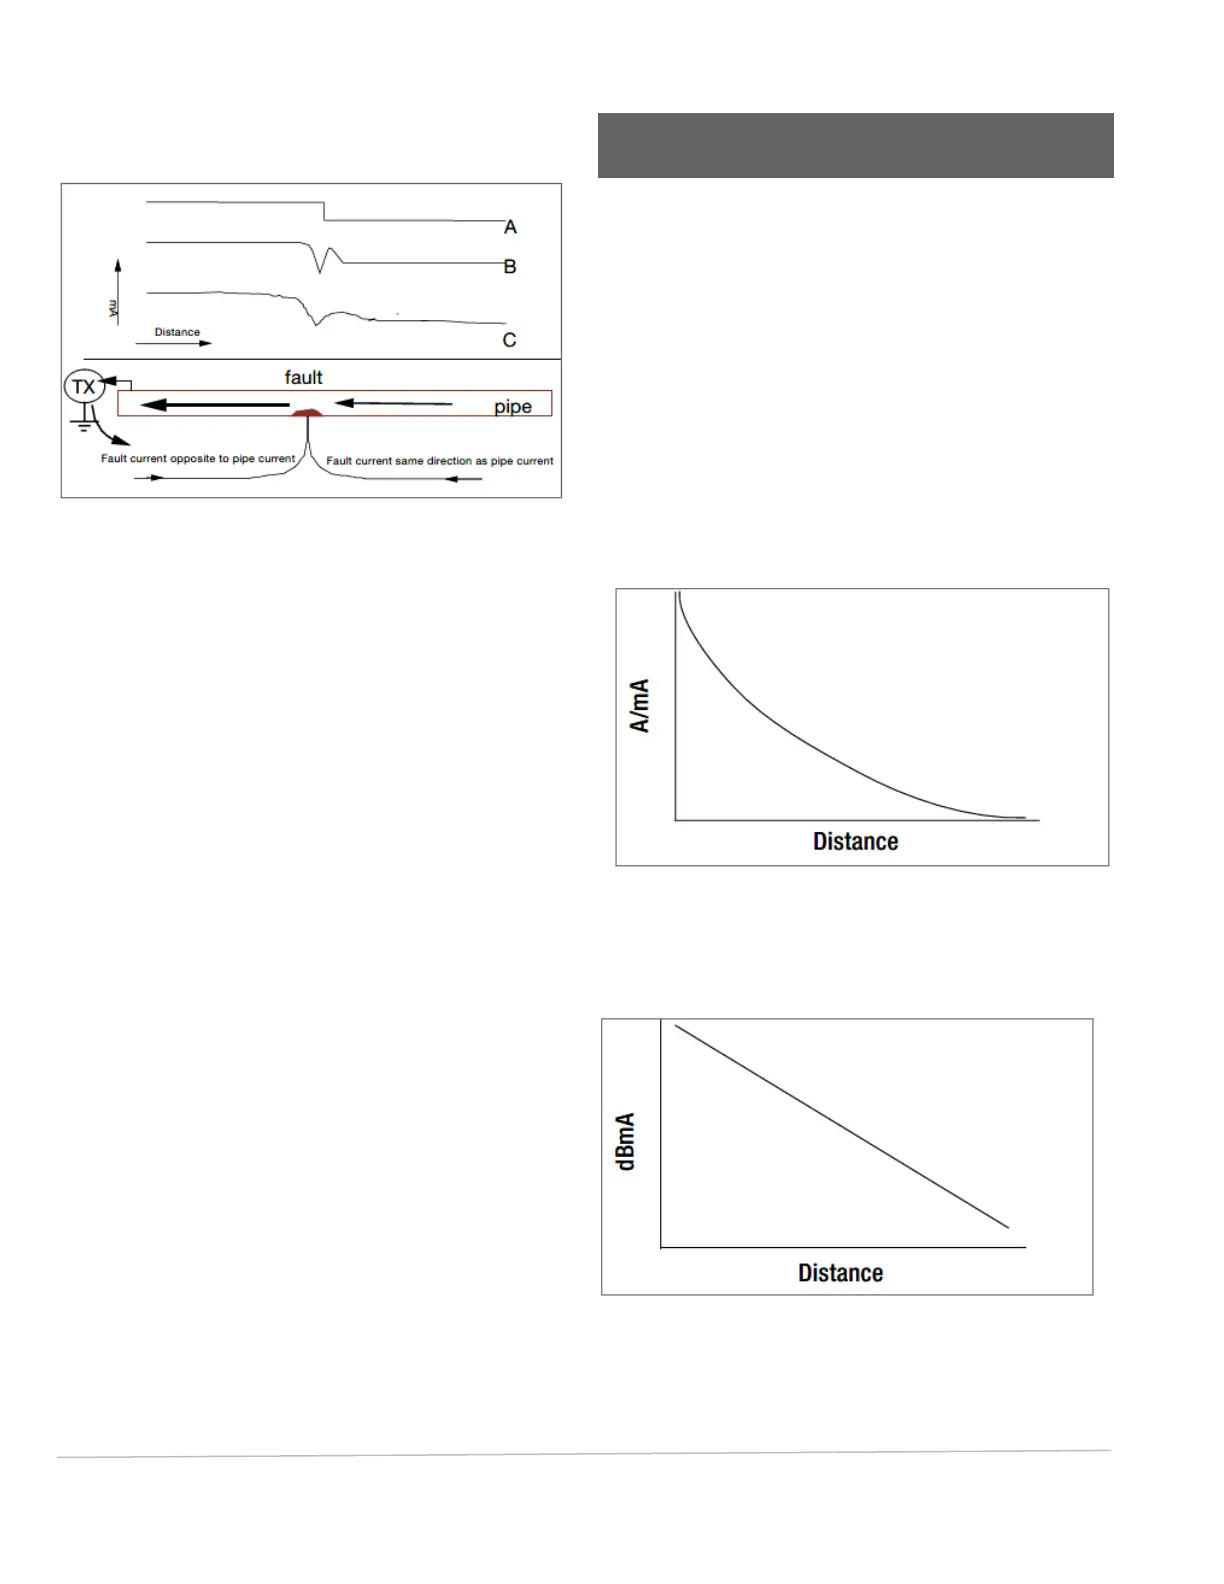
Converting the exponential mA result to logarithmic dBmA
will show the same graph as a straight line slope. See Fig.
8.3.
Fig. 8.3: dBmA fault graph
Displaying the results using dBmA loss per distance has
the advantage that the resulting graph is easier to analyze.