RT-7200 Auto Hematology Analyzer User’s Manual
The instrument will display 20-parameters QC result, if some parameters are not controlled,
the corresponding column shall be blank.
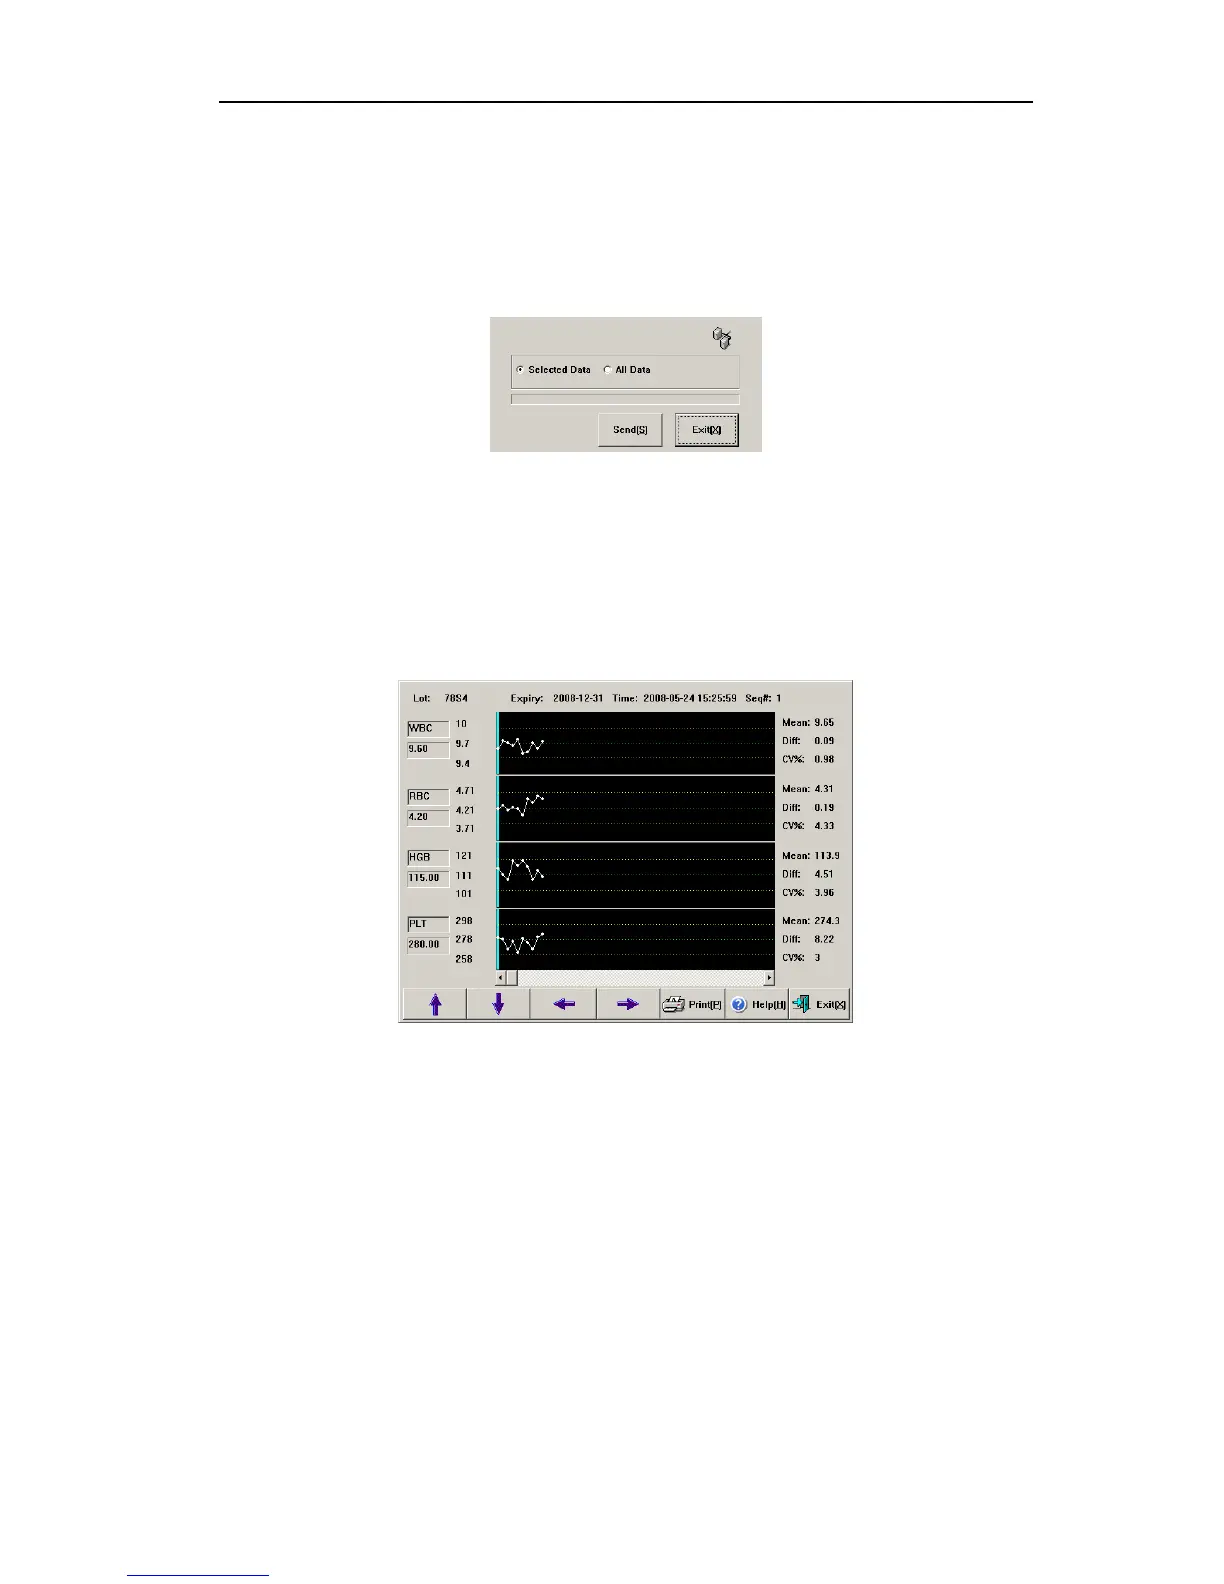
Send function can transfer part or all of the L-J QC data to external equipment. Use mouse
to click list column, select one group of QC data. Using keyboard Ctrl key or Shift key,
multiple columns can be selected. You can send all data, click “Send” button, open transfer
dialog box as follows:
Fig.4-5 L-J data transfer
Select data to be submitted, click “Send”.
Click “Delete” button, then delete confirmation dialog box pops up, after confirmed, you can
delete part of or all QC data. Selection method of part of data is the same as data transfer.
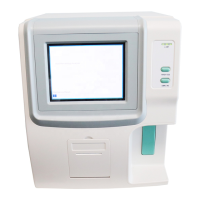
4.1.4 L-J QC chart
QC chart displays QC data distribution in graphs, to facilitate understanding of instrument
deviation trend. In main screen, select QC file, open QC chart screen, as follows:
Fig.4-6 L-J QC chart
Lot No.: lot Number of QC sample corresponding to QC file.
Expiry: validity period of QC sample.
Time: test time of datum corresponding to QC point.
Seq#: sequence number of current QC point in all QC data points.
Each screen displays four-parameter QC chart, Mean (average), Diff (standard deviation),
CV (variation coefficient) of each parameter.
Three values on the left of QC chart are, from top to bottom: QC sample target value +
deviation, QC sample target value, QC sample target value - deviation, respectively.
Press “↓”, “↑” keys on keyboard or frame to switch between items.
Press “←”, “→” keys on keyboard or frame, QC data of different sequence Numbers can be
shown.
Press “Print” button to print out one current group of QC data.
23