RT-7200 Auto Hematology Analyzer User’s Manual
points in chart will randomly distributed on both sides of centerline, the farther from
centerline, the nearer to upper/lower control limits, there will be fewer points. Graphic screen
is as follows:
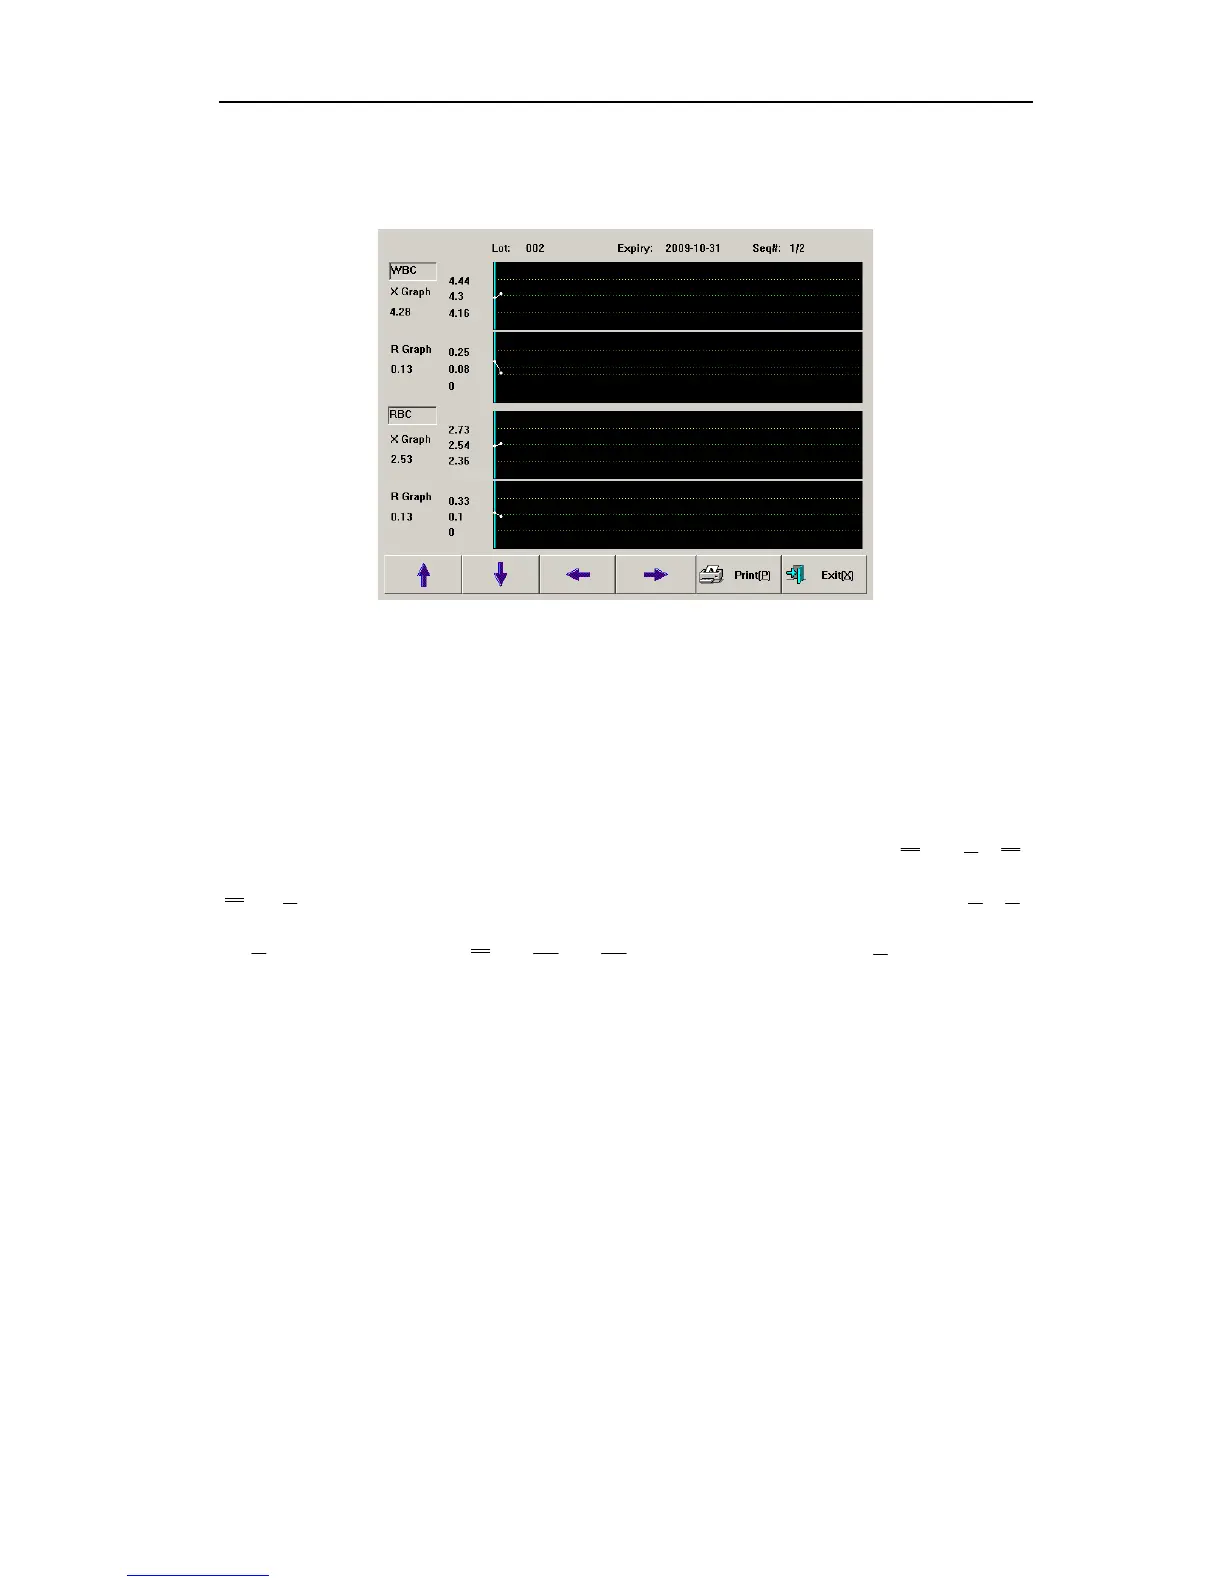
Fig.4-13 X-R QC chart
Lot No.: lot number of QC object
Expiry: validity period of QC object
Seq#.: sequence number of current QC point
Each screen displays two-parameter QC data distribution. QC chart of each parameter is
composed of X chart and R chart, reflecting QC data mean and range fluctuation
respectively. Three values on the left of X chart are, from top to bottom:
= /K, is
the difference between maximum and minimum of group i, K is subgroup quantity, , ,
are coefficients determined by number of samples in each group.
k
i 1=
Σ
i
R
i
R
2
A
4
D
3
D
Press “↓”, “↑” keys on keyboard or frame to switch between parameters.
Press “←”, “→” keys on keyboard or frame to display QC data of various sequence
numbers.
Press “Print” button to print out one current group of QC data.
28