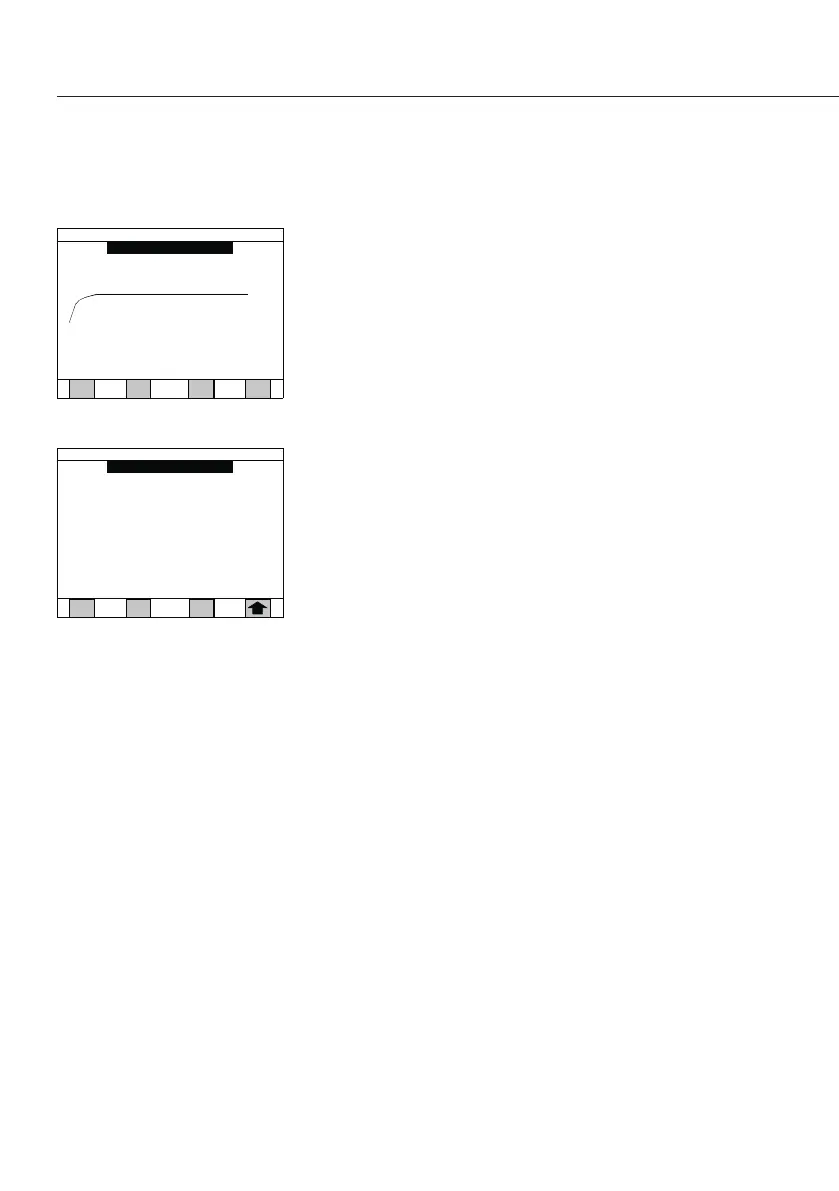
Graph:
The graph mode can be entered during or after
a test to show a graph of the weight versus time,
temperature versus time, or result versus time�
Data Log:
The data log mode is used for reviewing past
samples that have been tested� The log of samples can
be sorted, or samples can be manually selected to
perform statistical calculations�
18
Temperature / time
DRY MILK POWDER
09/07/2012 02:14 PM
Print Result
210
30
0.5 1.0 1.5 2.0 2.5 3.0 3.5 4.0 4.5 5.0 min
25.6 7 %
View Data Log
Down Up
Top
Dry milk power 09/07/2012 02:10
3.45%M 6.7min 672001
Dry milk power 09/07/2012 02:02
3.50%M 6.8min 672002
Dry milk power 09/07/2012 01:53
3.47%M 7.0min 672003