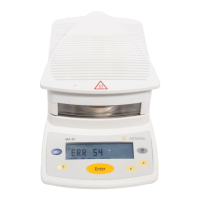
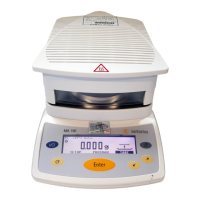
Graphing
Your analyzer is able to display and
print a graph of the current or last test�
Three styles of graphs are available:
– Percent|time
– Weight|time
– Temperature|time
To view the percent|time graph during
a test:
§ From the Test in Progress screen,
press the Graph soft key� The display
will show the Result|Time graph�
The graph automatically updates and
scales until the test is completed�
When the test has been completed it
will automatically scale one more time�
To view the weight|time graph during
a test:
§ From the Percent|Time graph, press the
Weight soft key�
To view the Temperature|Time graph
during a test:
§ From either the Percent|Time or
Weight|Time graphs, press the Temp
soft key�
To return to the Percent|Time graph:
§ From either the Weight|Time or
Temp|Time graphs, press the % (result)
soft key�
To return to the Test in Progress screen
during a test:
§ From any graph screen, press the
Test soft key�
To view a graph from the Test Done
or Standby screen after a test is com-
pleted:
§ Prior to running a new test, press the
Graph soft key�
To print any graph:
After the test is completed, from the
Test Done screen, press the Print soft
key while displaying any of the three
graphs�
48