Appendix
Operation Manual -
SP 30572
revDate
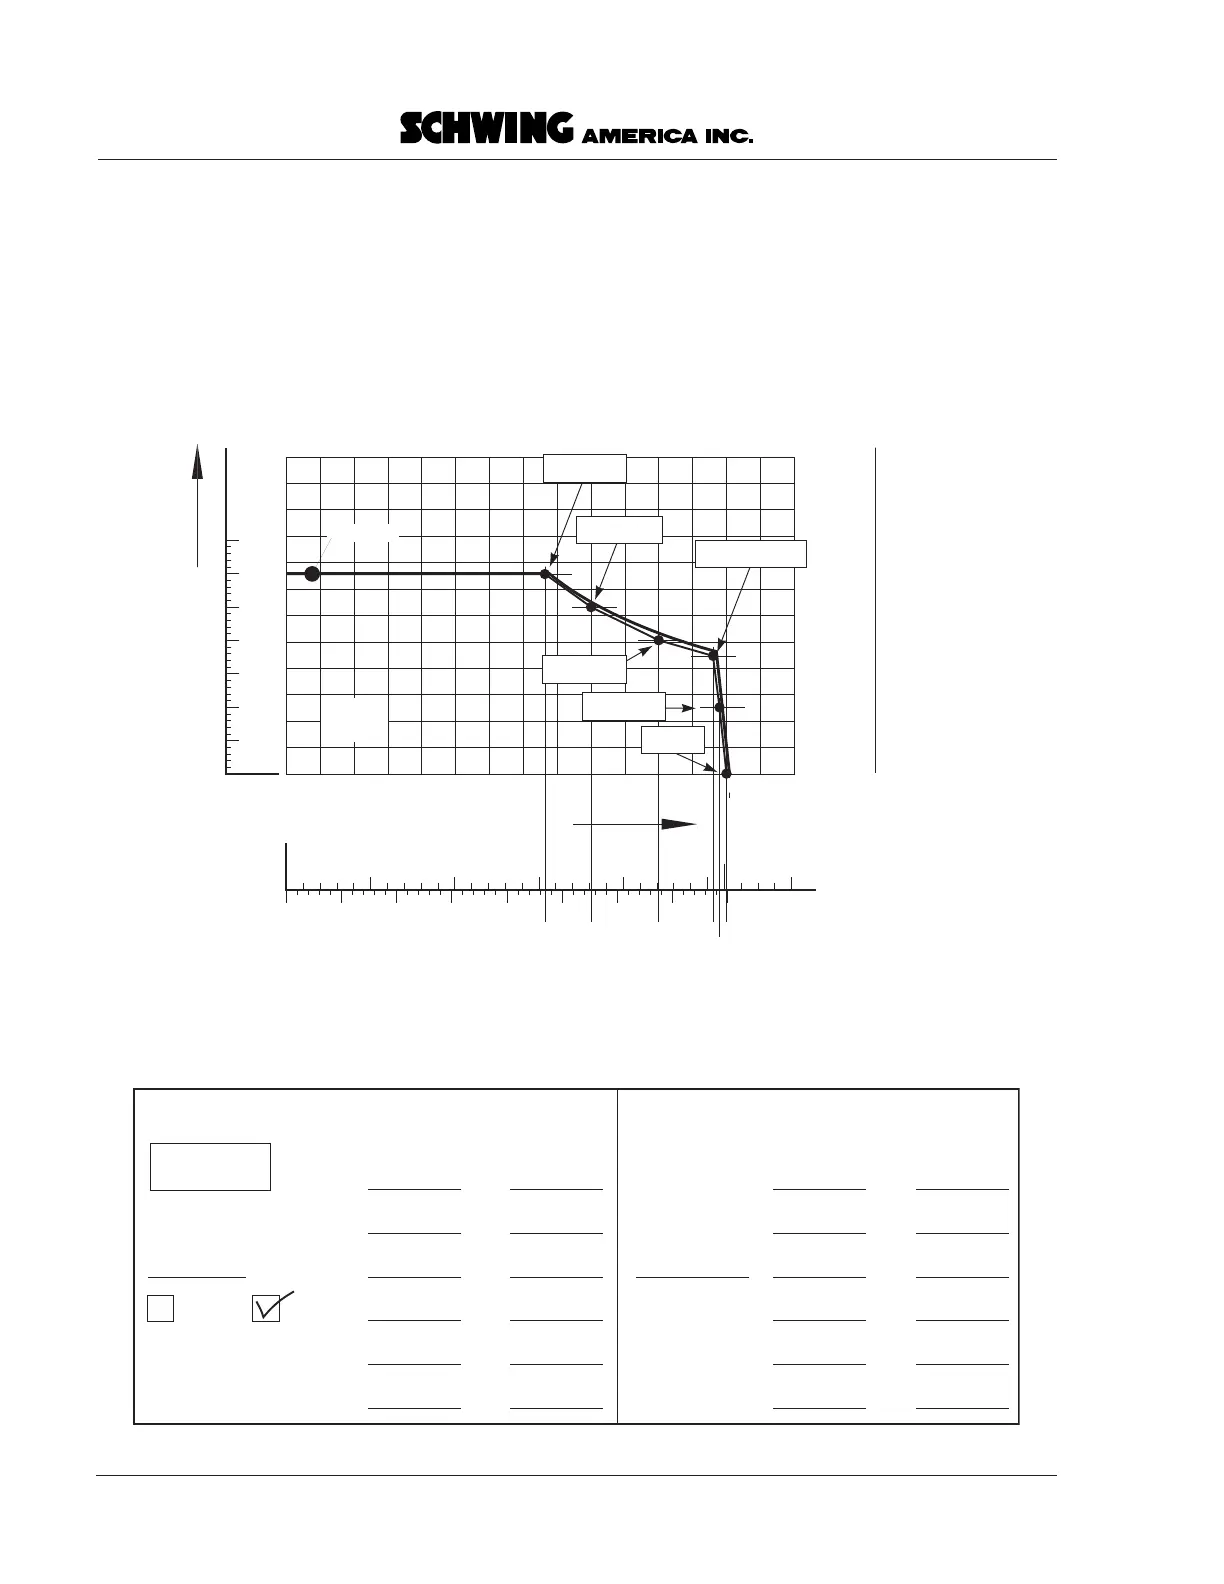
• Connect the dots. If your plotted line reason-
ably matches the specification plot on the
chart, the pump is fine. If your line is to the
lower left of the specification plot, the pump is
getting weak. If your line is to the upper right,
you have done the test incorrectly, or you are
using the wrong chart. In our example, the
pump is okay. (See the plot that follows.)
Check the second pump. Hook up the flowmeter just as
when you checked the first pump. Again, be sure that
you have the correct speed, gear, chart, and so on. This
time our example will have worse results.
13
CONCRETE OUTPUT (cu yd / h)
NUMBER OF STROKES
(stroke / min.)
OIL VOLUME
(liter / min.)
26 39 52 65 78 92 105 118 131 1440 157 170 183
ROD SIDE
ROD
SIDE
350
100 200 300 40050 150 250
51015202530
ROD SIDE
(bar)
CONCRETE
PRESSURE
(BAR)
7
14
21
28
34
41
48
55
62
70
76
83
CONCRETE
PRESSURE
(PSI)
100
200
300
400
500
600
700
800
900
1000
1100
1200
52758
50
100
150
200
250
300
350
OIL PRESSURE (BAR)
196
170.5
26
Breakpoint
breakpoint
178 bar
250 bar
300 bar
0 bar
100 bar
200 bar
(234) (276) (338) (388)
(392)
(398)
OK
Piston side scales have been removed for clarity
000317.eps
Liters/min
(read on meter)
Tota l
(for plotting)
0 bar
100 bar
breakpoint
150 or 200 bar
250 bar
300 bar
x 2
x 2
x 2
x 2
x 2
x 2
Liters/min
(read on meter)
Tota l
(for plotting)
x 2
x 2
x 2
x 2
x 2
x 2
1st Pump 2nd Pump
Breakpoint
specification
breakpoint
199
196
194
169
138
117
178
398
392
388
338
276
234
178
195
183
166
137
102
69
178
390
366
332
274
204
138
000030.eps