Operating Instructions
Page 19
Doc. 15301-RevB (2023-11-24)
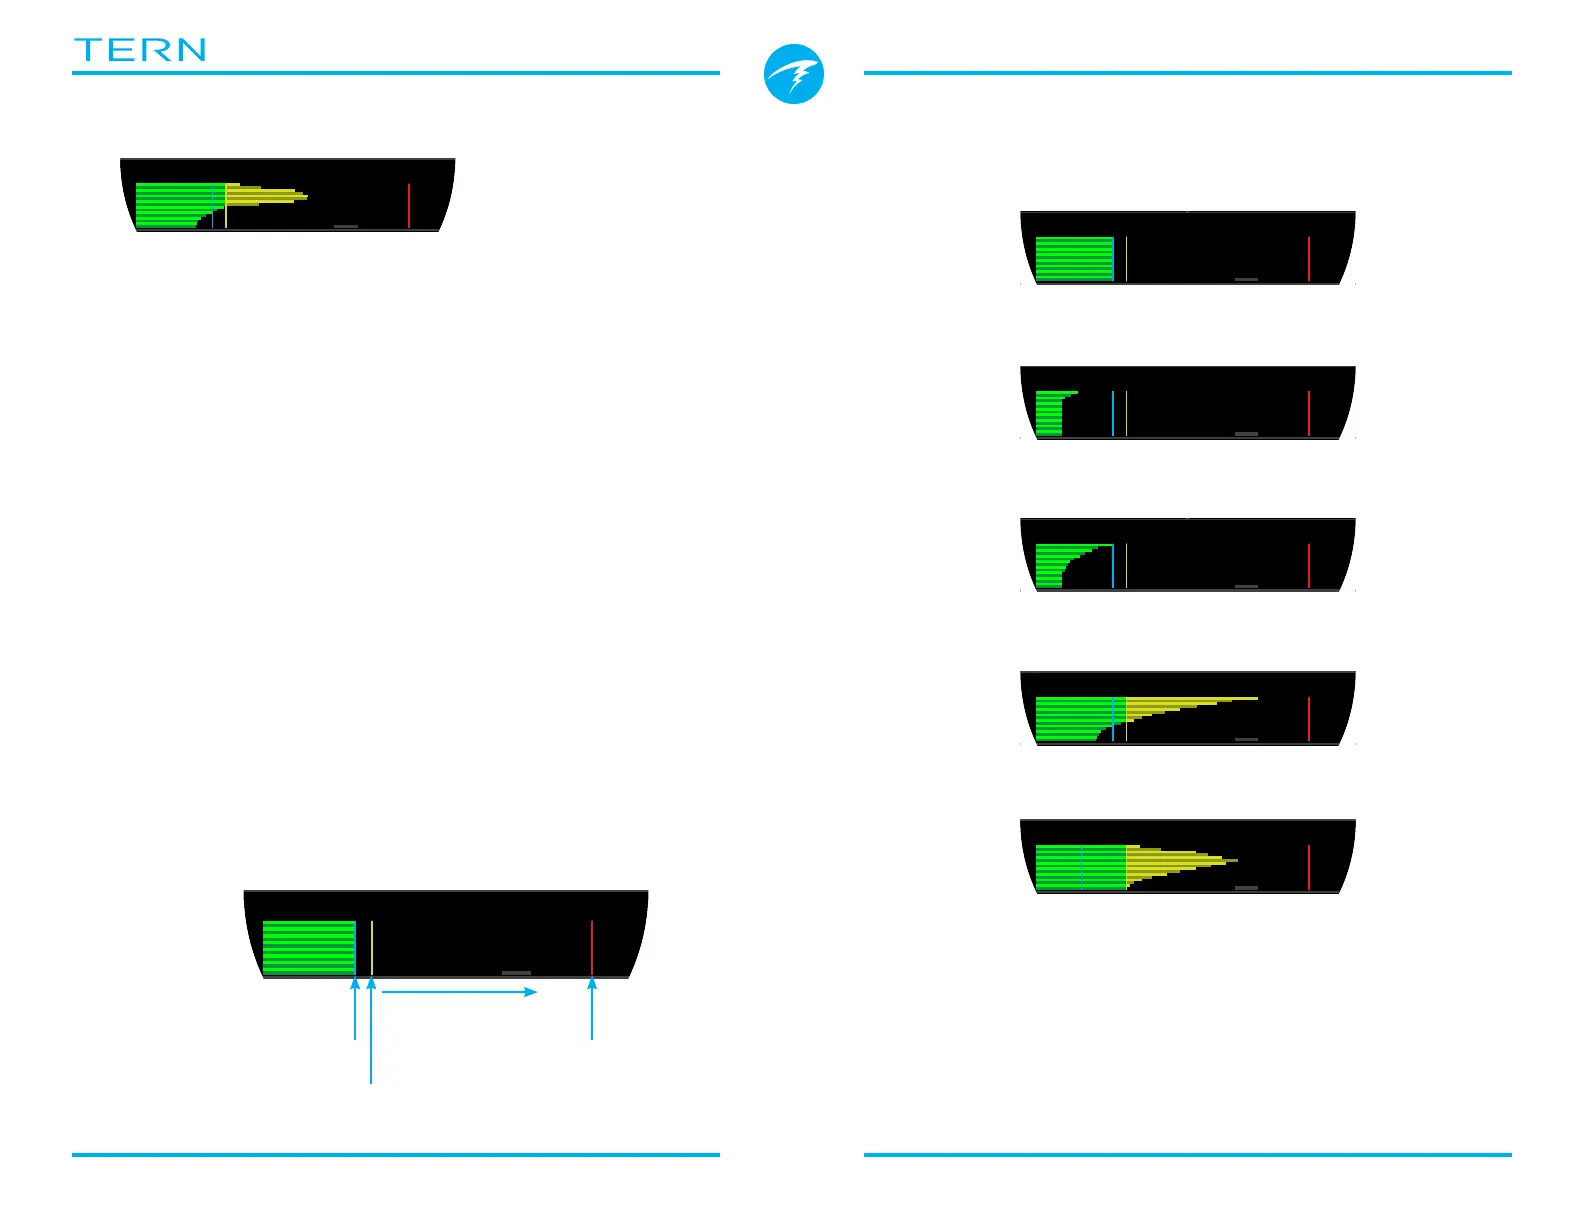
Sample Tissue Bar GraphsTissues Bar Graph
The tissues bar graph shows the tissue compartment
inert gas tissue tensions based on the Bühlmann ZHL-
16C model�
The fastest tissue compartment is shown on the top,
and the slowest on the bottom� Pressure increases to
the right�
The vertical cyan line shows the inert gas inspired
pressure� The yellow line is the ambient pressure� The
red line is the ZHL-16C M-Value pressure�
Tissues that are supersaturated above ambient
pressure are shown in yellow, and tissues that are
supersaturated above the M-Value are shown in red�
Note that the scale for each tissue compartment is
different� The reason the bars are scaled in this way is
so that the tissues tensions can be visualized in terms
of risk (i�e� how close they are as a percentage to
Bühlmann’s original super- saturation limits)� Also, this
scale changes with depth, since the M-Value line also
changes with depth�
Inspired inert
gas pressure
Ambient
Pressure
Increasing
Pressure
M-Value
Pressure
16 tissue
compartments
{
On surface (sat� with air)
Note: Gas is 79% N
2
(21% O
2
, or Air)
Immediately after descent
Deep Stop
On Gassing
Last deco Stop
Note: Gas is now 50% O
2
and 50% N2