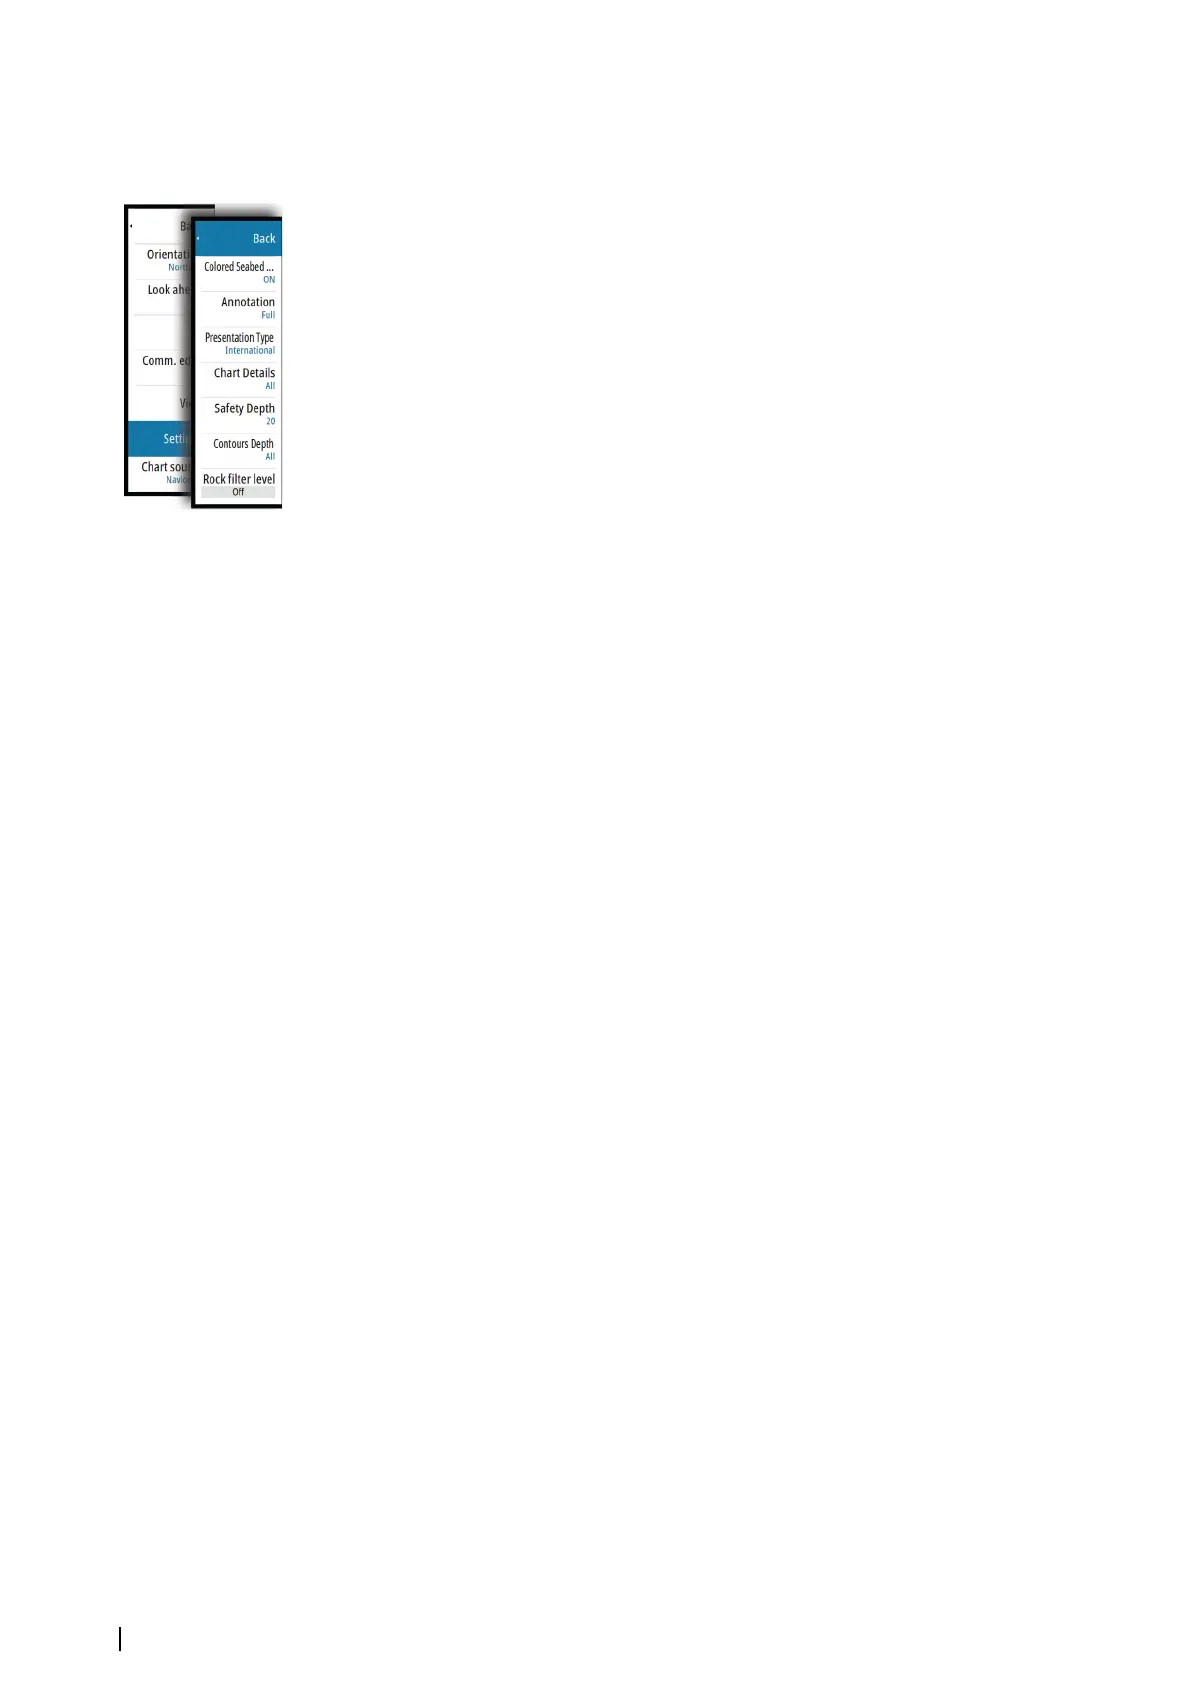
Navionics chart settings
Colored seabed areas
Used for displaying different depth areas in different shades of blue.
Presentation type
Provides marine charting information such as symbols, colors of the navigation chart and
wording for either International or U.S. presentation types.
Annotation
Determines what area information, such as names of locations and notes of areas, is available
to display.
Chart details
Provides you with different levels of geographical layer information.
Safety depth
The Navionics charts use different shades of blue to distinguish between shallow and deep
water.
Safety depth, based on a selected limit, is drawn without blue shading.
Ú
Note: The built in Navionics database features data down to 20 m, after which it is all
white.
Contours depth
Determines which contours you see on the chart down to the selected safety depth value.
Rock filter level
Hides rock identification on the chart beneath a given depth.
This helps you to declutter charts in areas where there are many rocks located at depths well
below your vessel's draught.
Jeppesen charts
All possible menu options for Jeppesen charts are described below. The Jeppesen features
and menu options can vary depending on the Jeppesen charts you use.
Jeppesen tides and currents
The system can display Jeppesen tides and currents. With this information it is possible to
predict the time, level, direction and strength of currents and tides. This is an important tool
when considering planning and navigation of a trip.
In large zoom ranges the tides and currents are displayed as a square icon including the
letter T (Tides) or C (Current). When you select one of the icons, tidal or current information
for that location are displayed.
Dynamic current data can be viewed by zooming inside a 1-nautical mile zoom range. At
that range, the Current icon changes to an animated dynamic icon that shows the speed and
direction of the current. Dynamic icons are colored in black (greater than 6 knots), red
(greater than 2 knots and less than or equal to 6 knots), yellow (greater than 1 knot and less
than or equal to 2 knots) or green (equal to or less than 1 knot), depending on the current in
that location.
If there is no current (0 knots) this will be shown as a white, square icon.
34
Charts | NSO evo2 Operator Manual