T15h Tag Deployment & User Guide
72
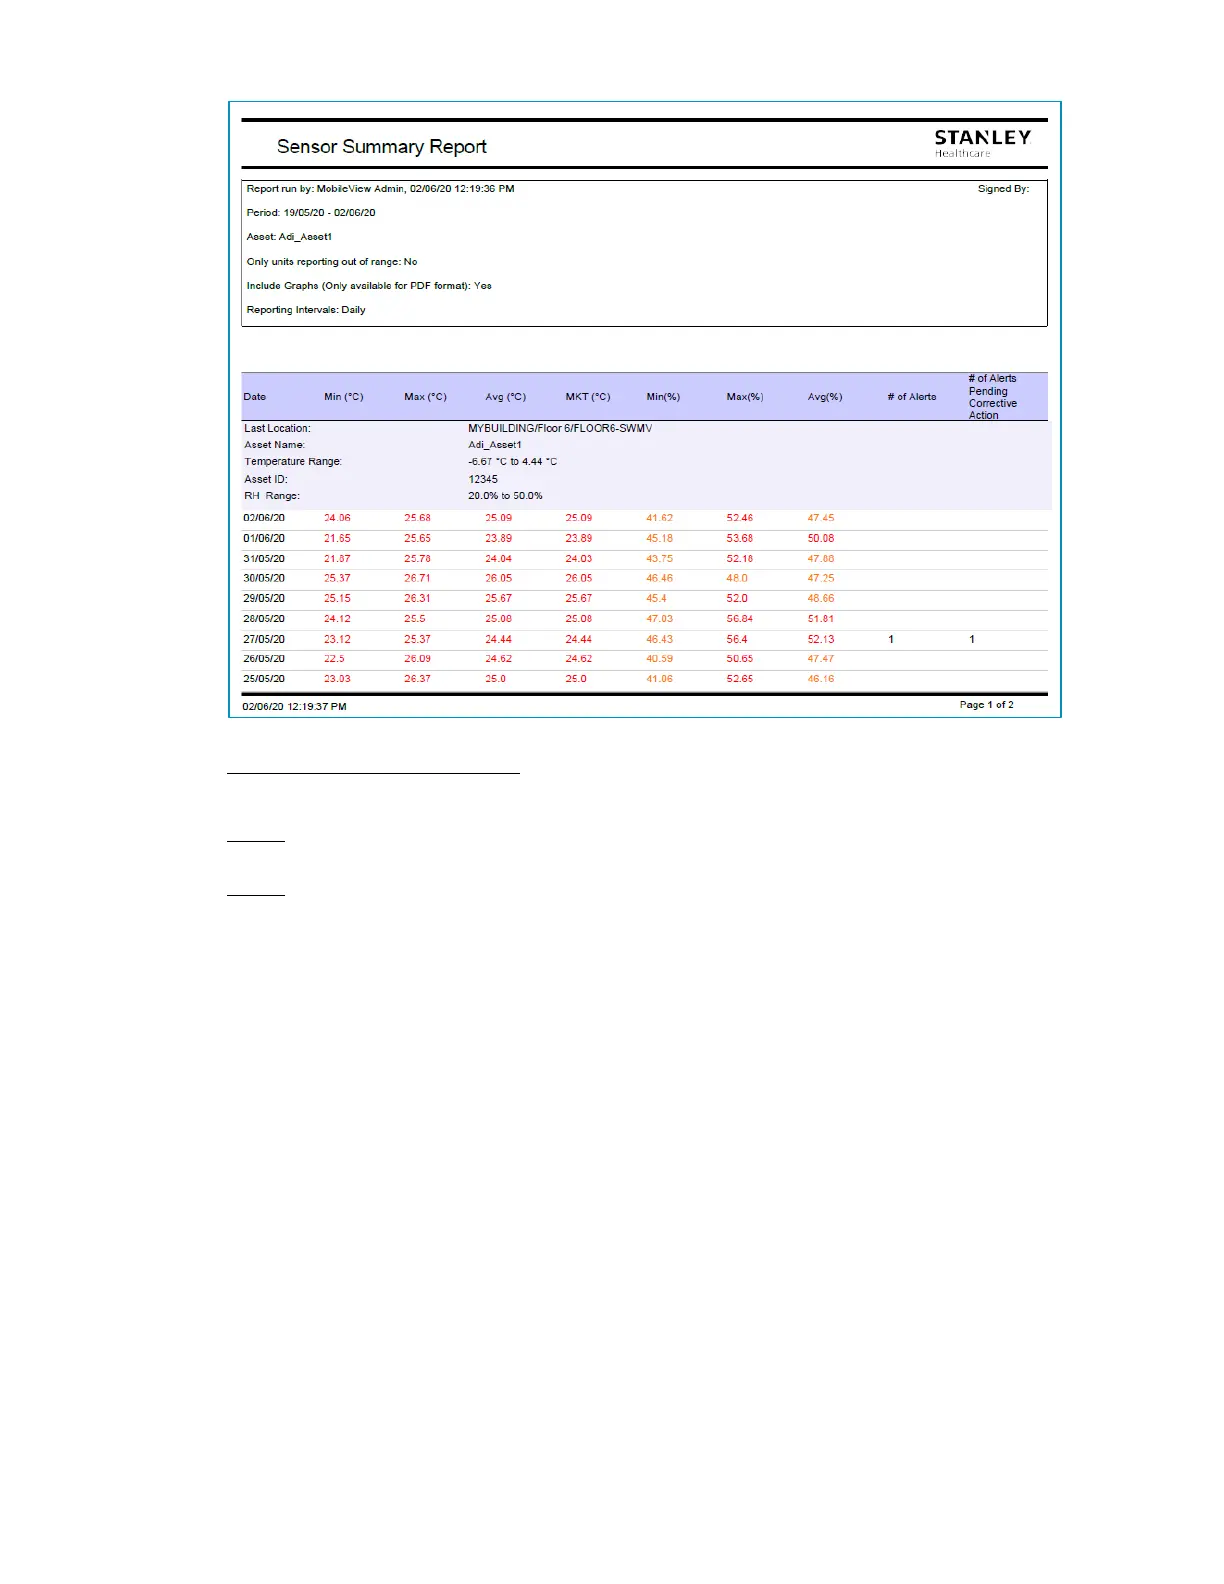
Advanced Display Settings
Include Graphs
Note: Graphs are only available when using PDF format.
Note: Not available for Contact Sensors.
By default, the report will include Graphs. The report will show a graph for
each tag sensor (1 graph for temperature and 1 graph for humidity).
Reporting Intervals can be either on a Daily basis (min and max values on a
daily basis during the defined period) or Period (min and max values during
the defined period). Uncheck Include Graphs to exclude the Graphs from the
report.
The following details are displayed in the report:
Asset Name
Asset ID
Temperature/Humidity Range (Red text - Critical)
Configured Warning Range (Orange text)
 Loading...