30
Monitoring
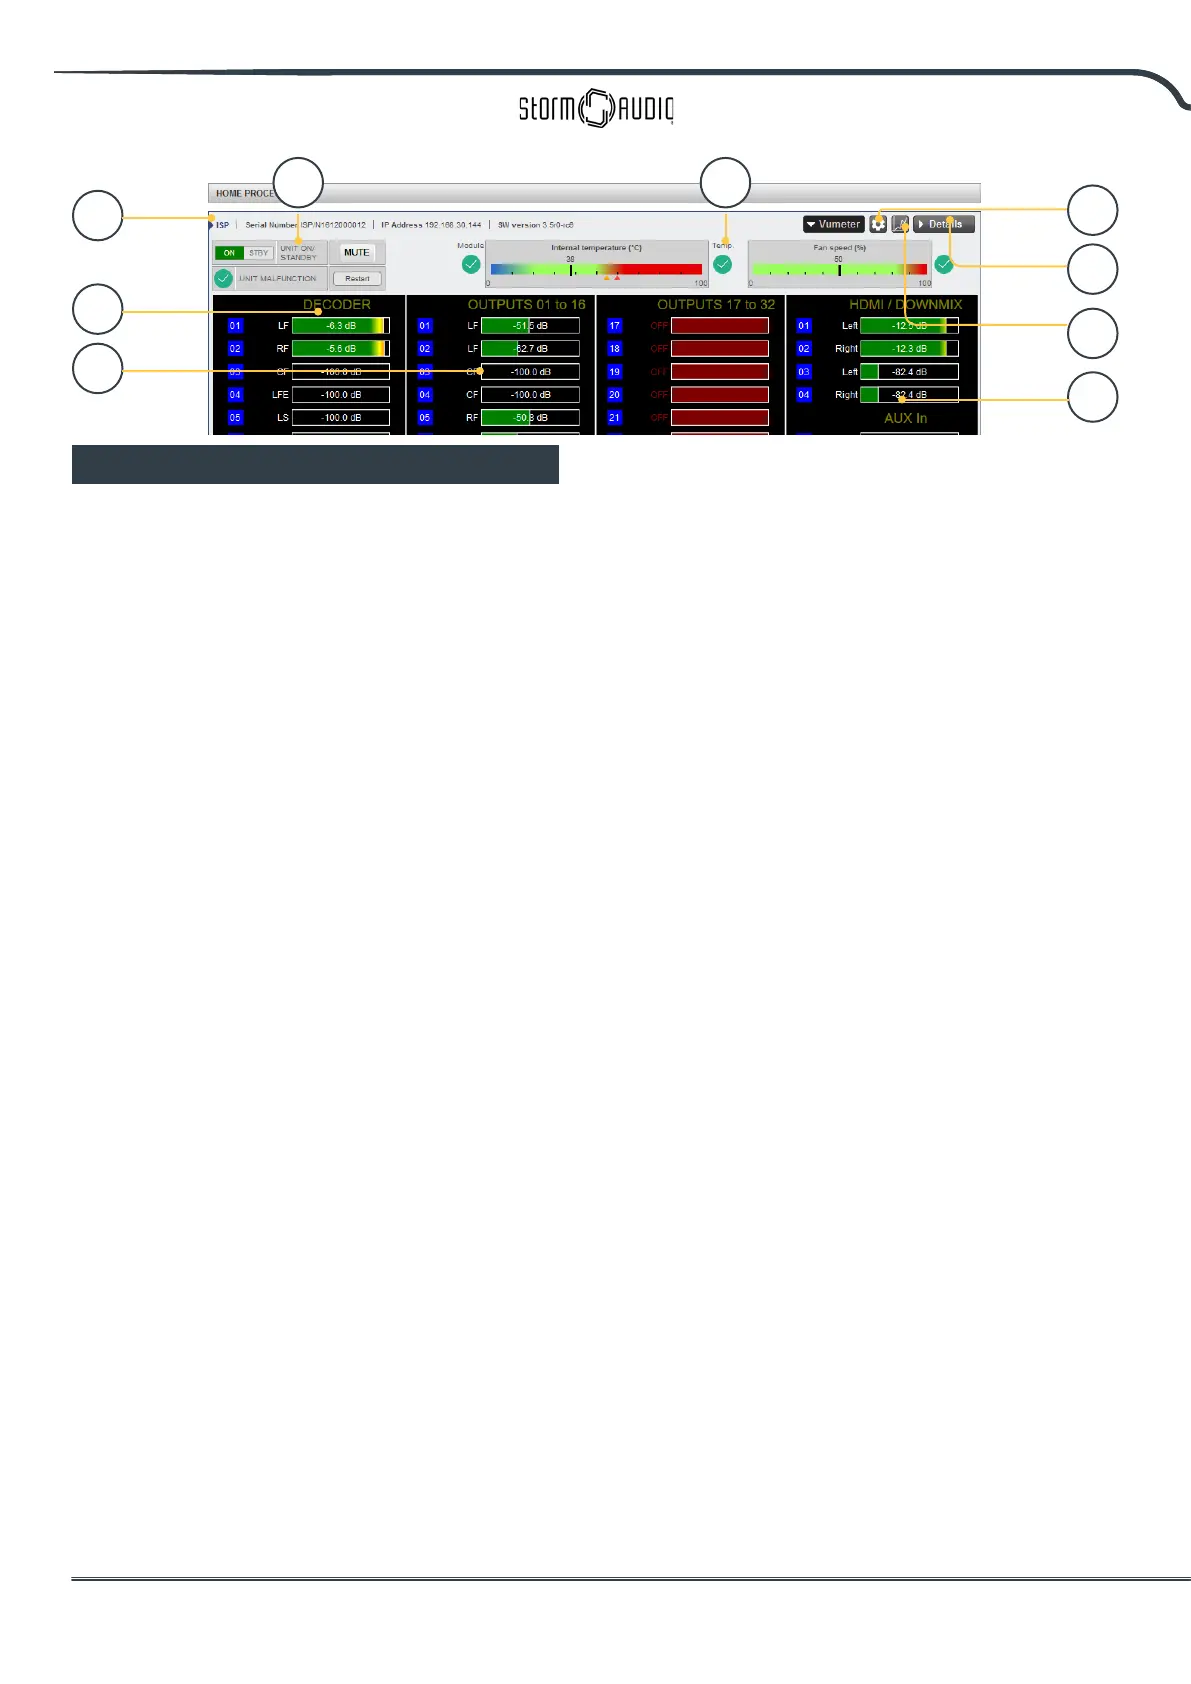
Accessing the Monitoring page powered by
StormMonitoring, you will get detailed information
about the operation of the ISP.
1. Product Information
Model, serial number, IP address and rmware
version information are listed.
2. Basic Status
Indicator and control over On/Standby, Mute,
and system restart as well as malfunction
indicator.
3. Temperature / Fan Speed
Two indicators show the current temperature
(black line) and rear fan speed. Orange markers
indicate current settings for system warning
and critical high temperature.
To view items 4-6, click the VU Meter button to
expand the page.
4. Decoder
Visualize the realtime level of audio channels
being received by the decoder. For example, if
2 channel PCM is being received, you will see
activity on LF and RF.
5. Outputs
Visualize real time audio output of each output
channel on the rear panel. For instance, if 5.1
audio is being received and the current upmix
is Native, you will see activity on LF, CF, RF, SUB,
LS and RS channels. Useful for verifying if audio
should be present on an output.
6. HDMI/DOWNMIX
Visualize audio output on the HDMI outputs
and XLR downmix outputs.
7. Logging
Logging is a useful feature to help identify
strange behavior with potential problems
caused by heat. Click the graph button to show
a line chart of either temperature or fan speed
over time. Use the options in the popup to
choose timeframe, zoom or move around the
plot or export the image.
8. Details
Click to expand a window showing detailed
information about audio and video coming into
the player including format, resolution, color
space, copy protection and more. Important
information about the video transmission is
also detailed. Compare this information against
the compatibilities of connected hardware to
diagnose errors in picture or sound. Further,
it shows real time health of various power
supplies in the unit which power specic
modules. This can be a useful tool to diagnose
features that are malfunctioning.
9. Thresholds settings
It is possible to dene your own alert threshold
for the temperature of the unit. Click on the
Gear icon and adjust these thresholds. Default
is 55°C and 60°C. When the temperatures are
reached, messages will be shown in the various
interfaces.
1
5
6
7
8
4
2 3
9