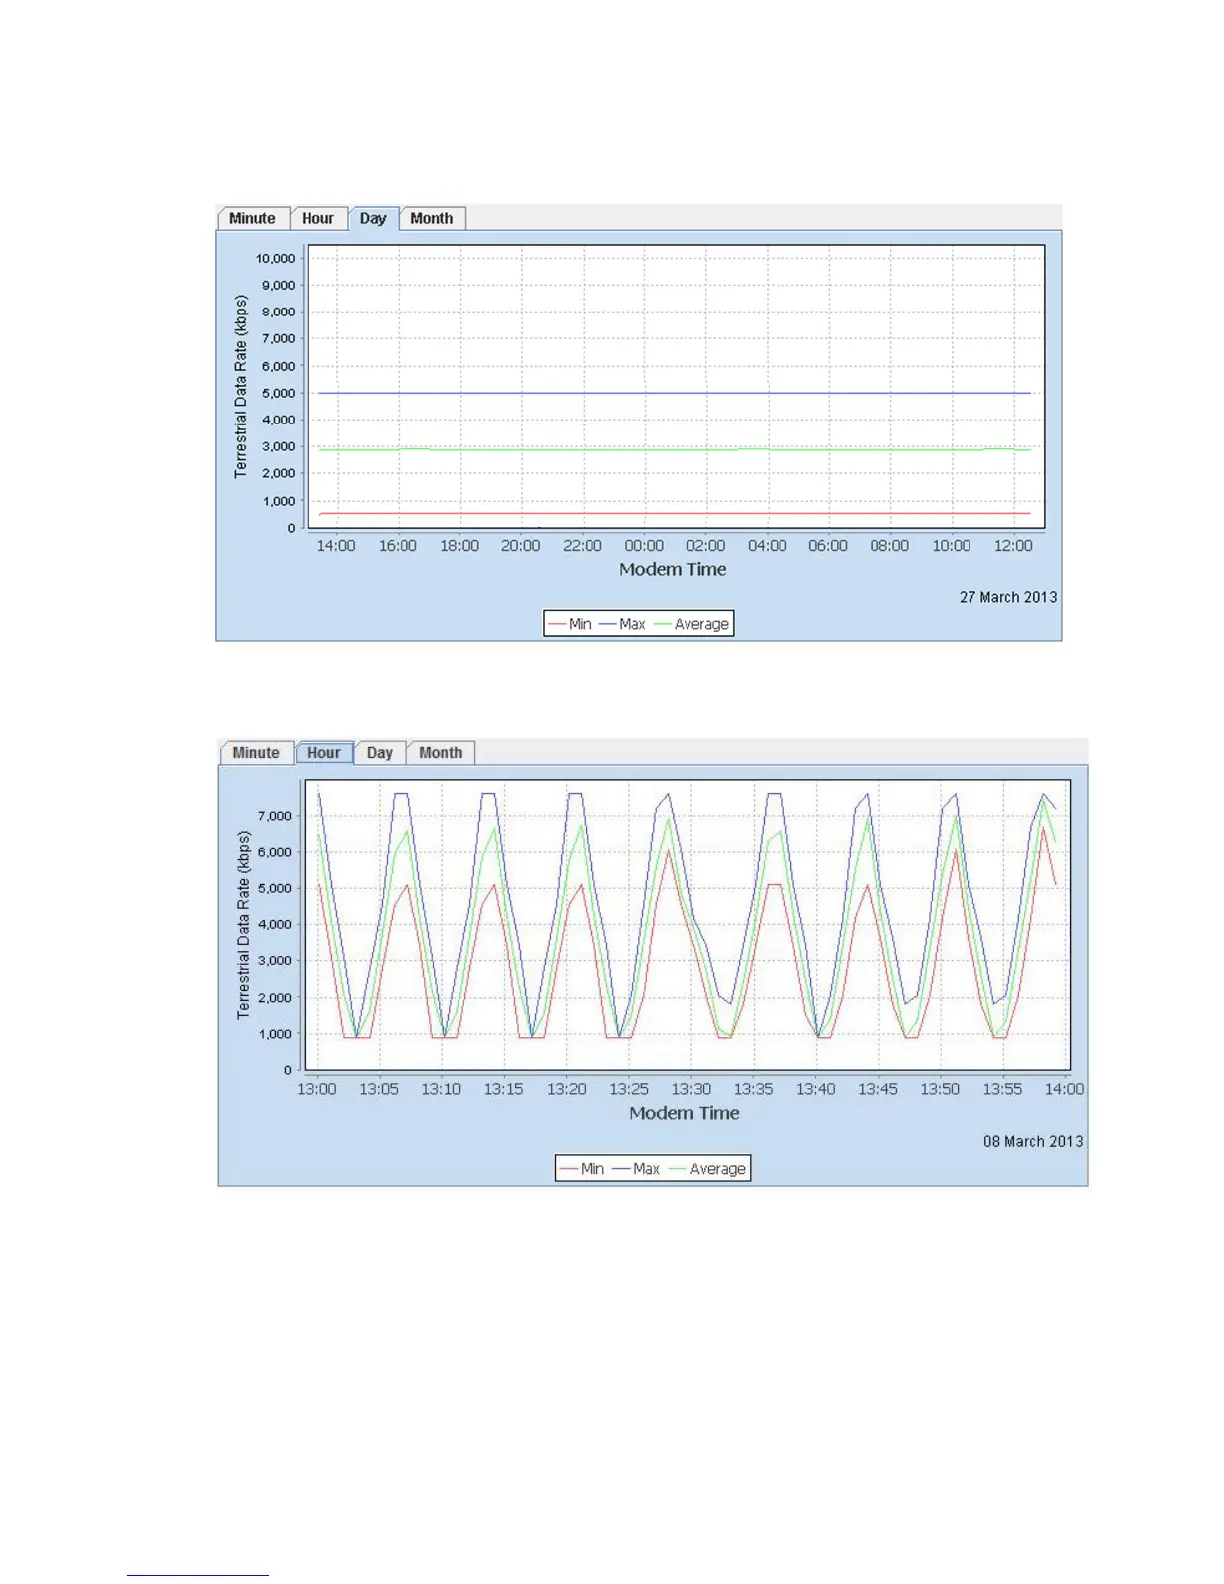
Figure 6-41 ACM Terrestrial Data Rate Graph
Figure 6-42 ACM Terrestrial Data Rate Graph (Short time period)
6.2.10.4 Other Time-based Graphs
A number of time-based graphs can be displayed. Graphical values are stored for 31
calendar days or until the modem is powered down. The recording of all values occurs
automatically at all times once the modem is powered on and is not dependent on
whether the graphs are being viewed or not.
 Loading...