Lab 8: IQmath FIR Filter
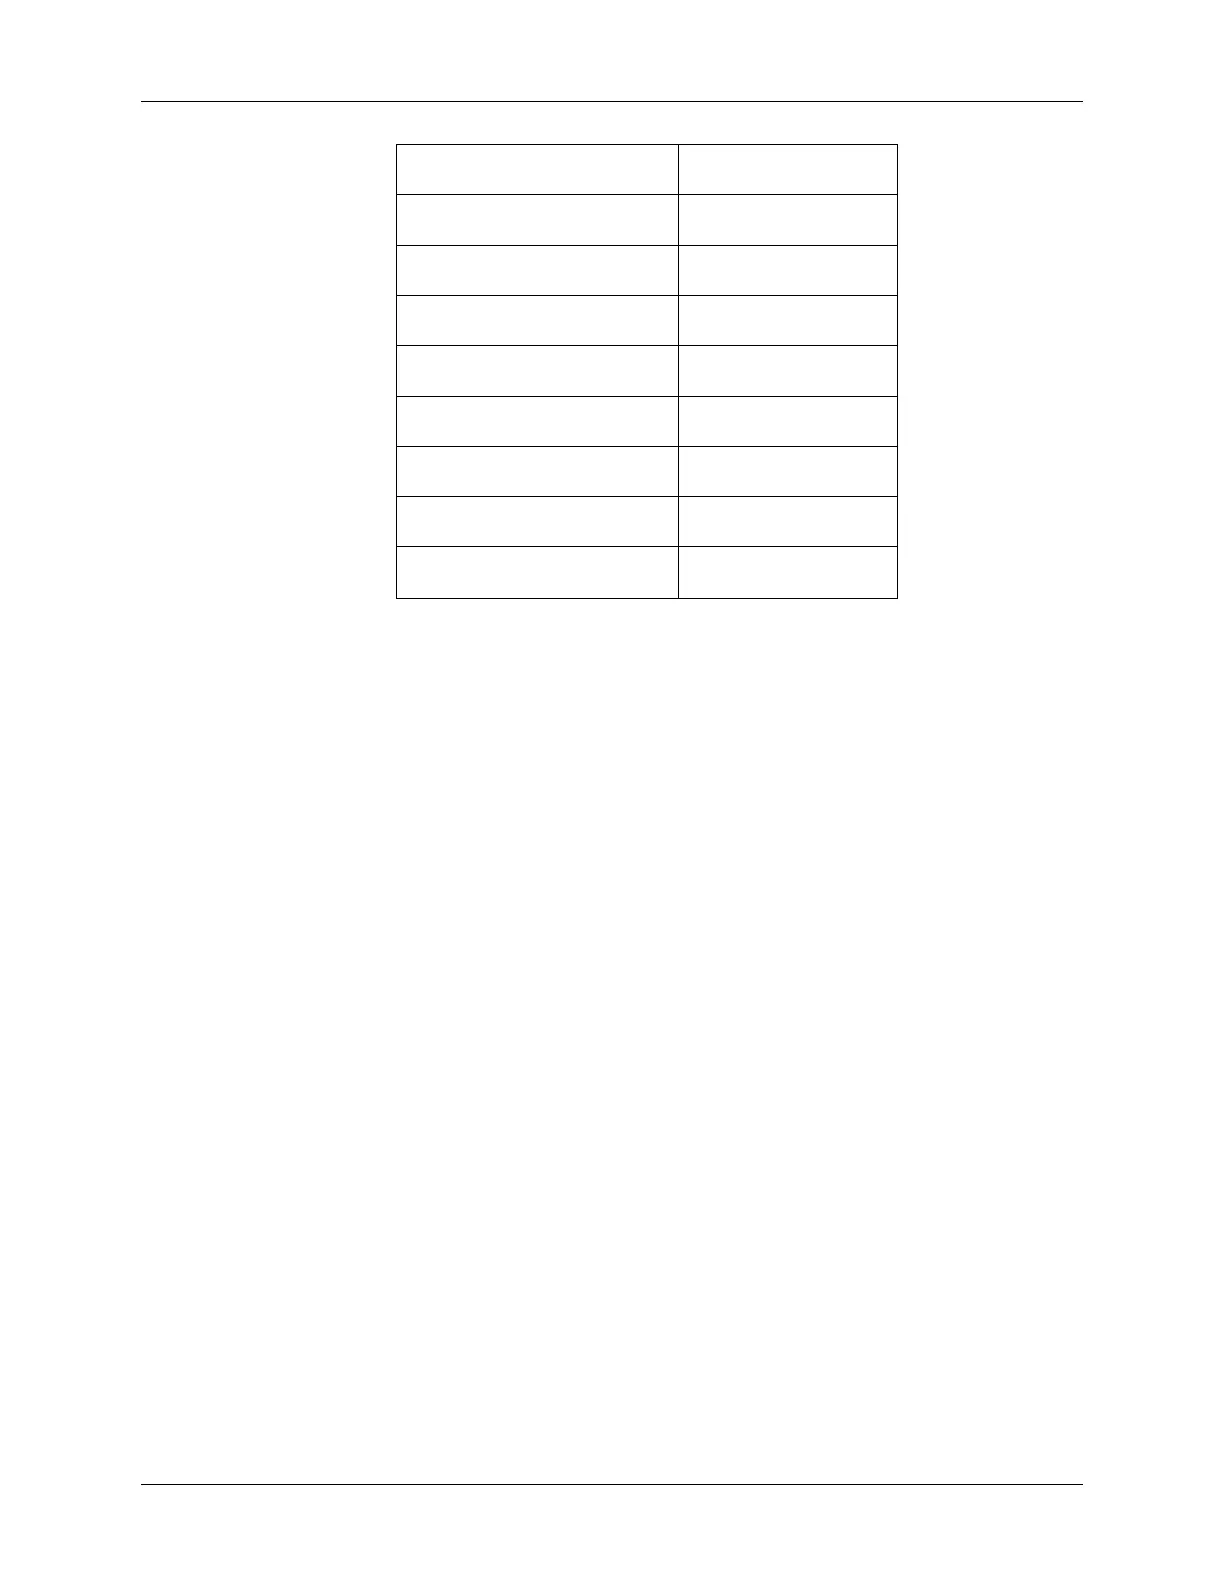
Display Type Dual Time
Start Address – upper display AdcBufFiltered
Start Address – lower display AdcBuf
Acquisition Buffer Size 50
Display Data Size 50
DSP Data Type 32-bit signed integer
Q-value 24
Sampling Rate (Hz) 50000
Time Display Unit
µs
Select OK to save the graph options.
13. The graphical display should show the generated IQmath FIR filtered 2 kHz, 25% duty
cycle symmetric PWM waveform in the upper display and the unfiltered waveform
generated in the previous lab exercise in the lower display. Notice the shape and phase
differences between the waveform plots (the filtered curve has rounded edges, and lags
the unfiltered plot by several samples). The amplitudes of both plots should run from 0
to 3.0.
14. Fully halt the DSP (real-time mode) by using Debug Halt and then unchecking the
“Real-time mode”.
End of Exercise
C28x - Numerical Concepts & IQmath 8 - 39
 Loading...