Goblin – Operational Manual
TRINITY
[21]
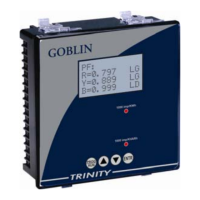
The eighth page shows the KW present Demand (DM) along with the Maximum
Demand (MD) reached. There are a few points regarding Demand and maximum
demand display, which need to be noted.
The demand is integrated over 30 minutes or 15 minutes in both FIX and
SLIDING WINDOW.
If the demand is calculated by the meter, based on sliding window
technique, then unlike utility installed demand meters, this demand figure
does not reset to zero at the end of the 15 minutes or 30 minutes
integration window.
The ninth page indicates the date and time of last KW maximum demand (LMD)
occurrence and status of the logging buffer. This value holds for the user the value
of maximum demand (MD) as it was, before it was reset. For example let present
maximum demand be 400 KW. Now if the user reset MD then MD will become
zero and LMD will hold the value 400KW.
The tenth page shows the KVA present Demand (DM) along with the Maximum
Demand (MD) reached. There are a few points regarding Demand and maximum
demand display, which need to be noted.
The demand is integrated over 30 minutes or 15 minutes in both FIX and
SLIDING WINDOW.
KVA DM=440
KVA MD=451
Dt=02/11/00
Tm=21:19:25
LMD KW=400
Dt=21/01/11
Tm=11.45.17
KW DM=456
KW MD=751
Dt=02/11/00
Tm=21:19:25