Goblin – Operational Manual
TRINITY
[22]
If the demand is calculated by the meter, based on sliding window
technique, then unlike utility installed demand meters, this demand figure
does not reset to zero at the end of the 15 minutes or 30 minutes
integration window.
The eleventh page indicates the date and time of last KVA maximum demand
(LMD) occurrence. This value holds for the user the value of maximum demand
(MD) as it was, before it was reset. For example let present maximum demand be
445 KVA. Now if the user reset MD then MD will become zero and LMD will hold
the value 445KVA.
The twelfth to fourteenth page show Odd Harmonics voltage of R-Phase, Y-Phase
and B-Phase, 15th to 17
th
page show Odd Harmonics current of R-phase, Y-
Phase and B-Phase with the same display. However, the harmonics data will be
different accordingly.
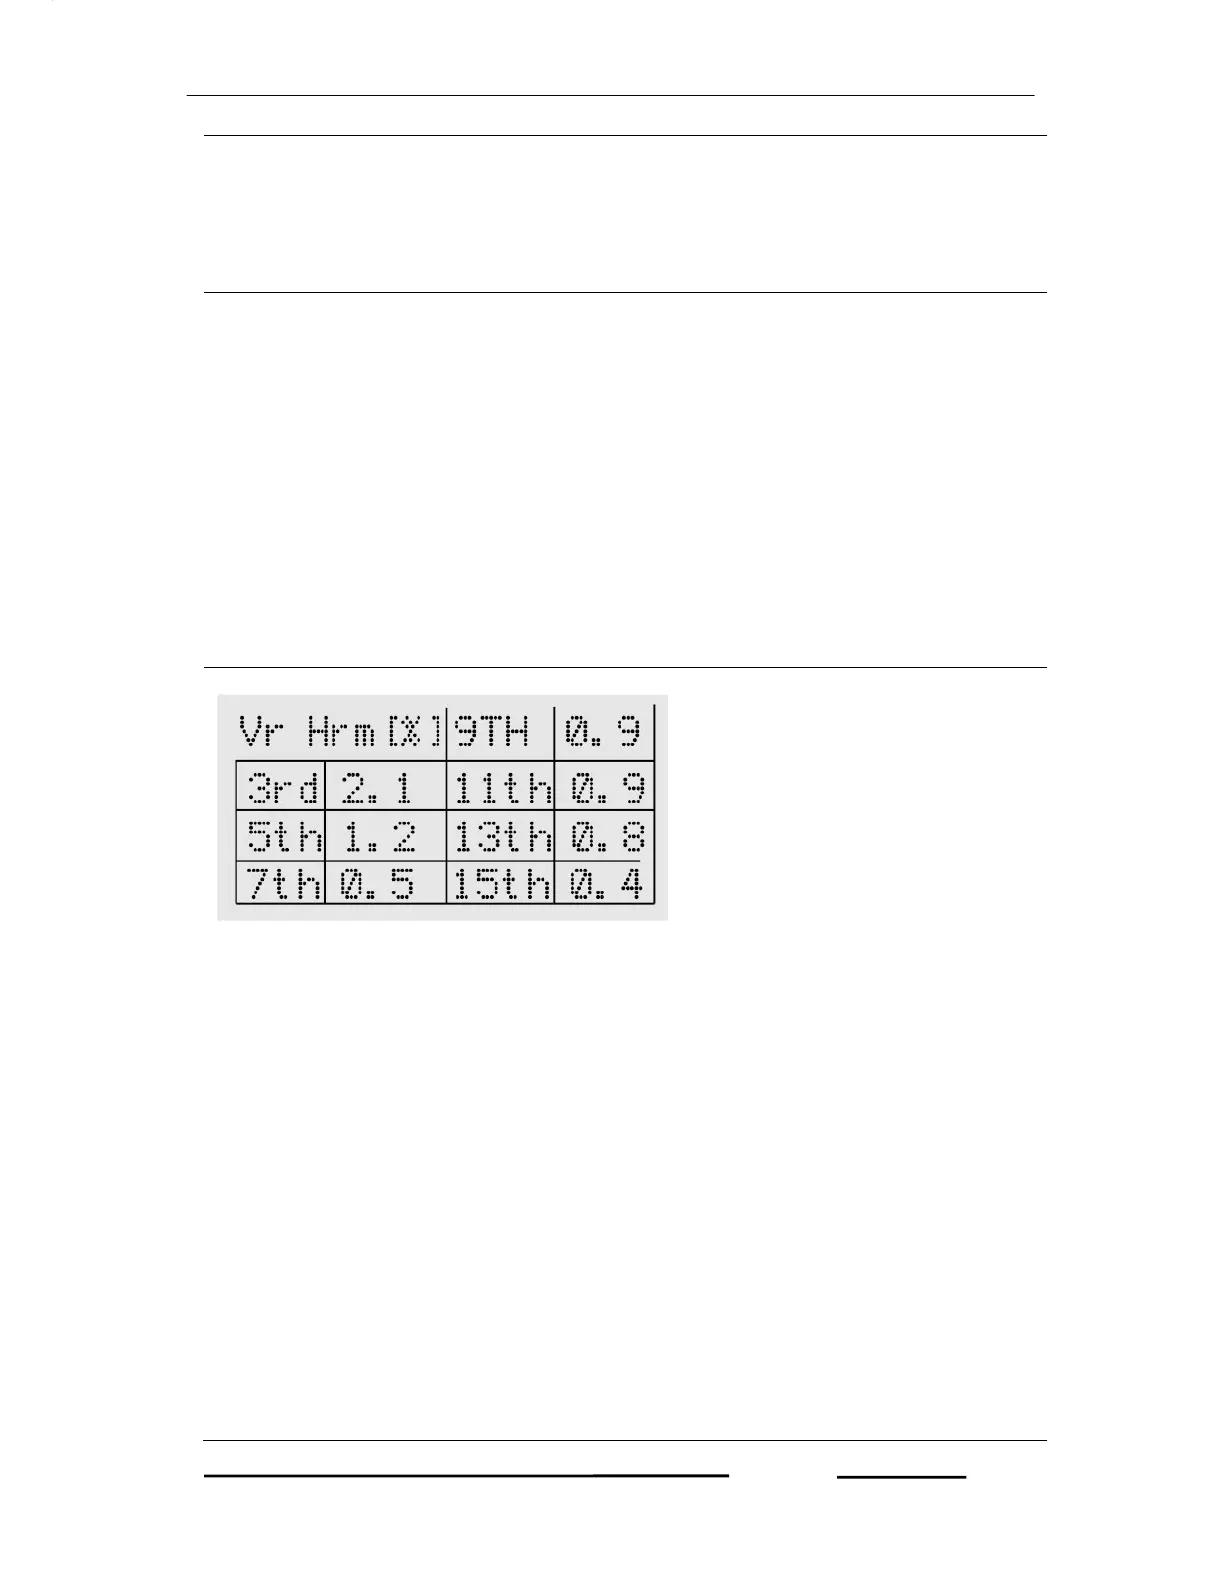
The meter measures and displays the Harmonic contents of all the voltage and
current waveforms. This data is normalized against the strength of the
fundamental frequency. In other words, the fundamental is always at 100%, and
the strength of the higher harmonics are expressed as the percentage (%) of the
fundamental. The highest order of the Harmonics displayed is 15th. Thus, the
meter shows third, fifth, seventh, ninth, eleventh, thirteenth and fifteenth
harmonics, for each voltage and current.
The method of calculating the Harmonics is by taking samples and subjecting
those to Digital Signal Processing technique of Fast Fourier Transform. The data
is averaged and updated once every six seconds.
The current channels need to have a minimum current of 3.2 % of the rated CT
secondary, for FFT to be run on the samples. If the current is less than this limit,
LMD KVA=445
Dt=01/02/11
Tm=12:22:12