Goblin – Operational Manual
TRINITY
[31]
Graph Representation
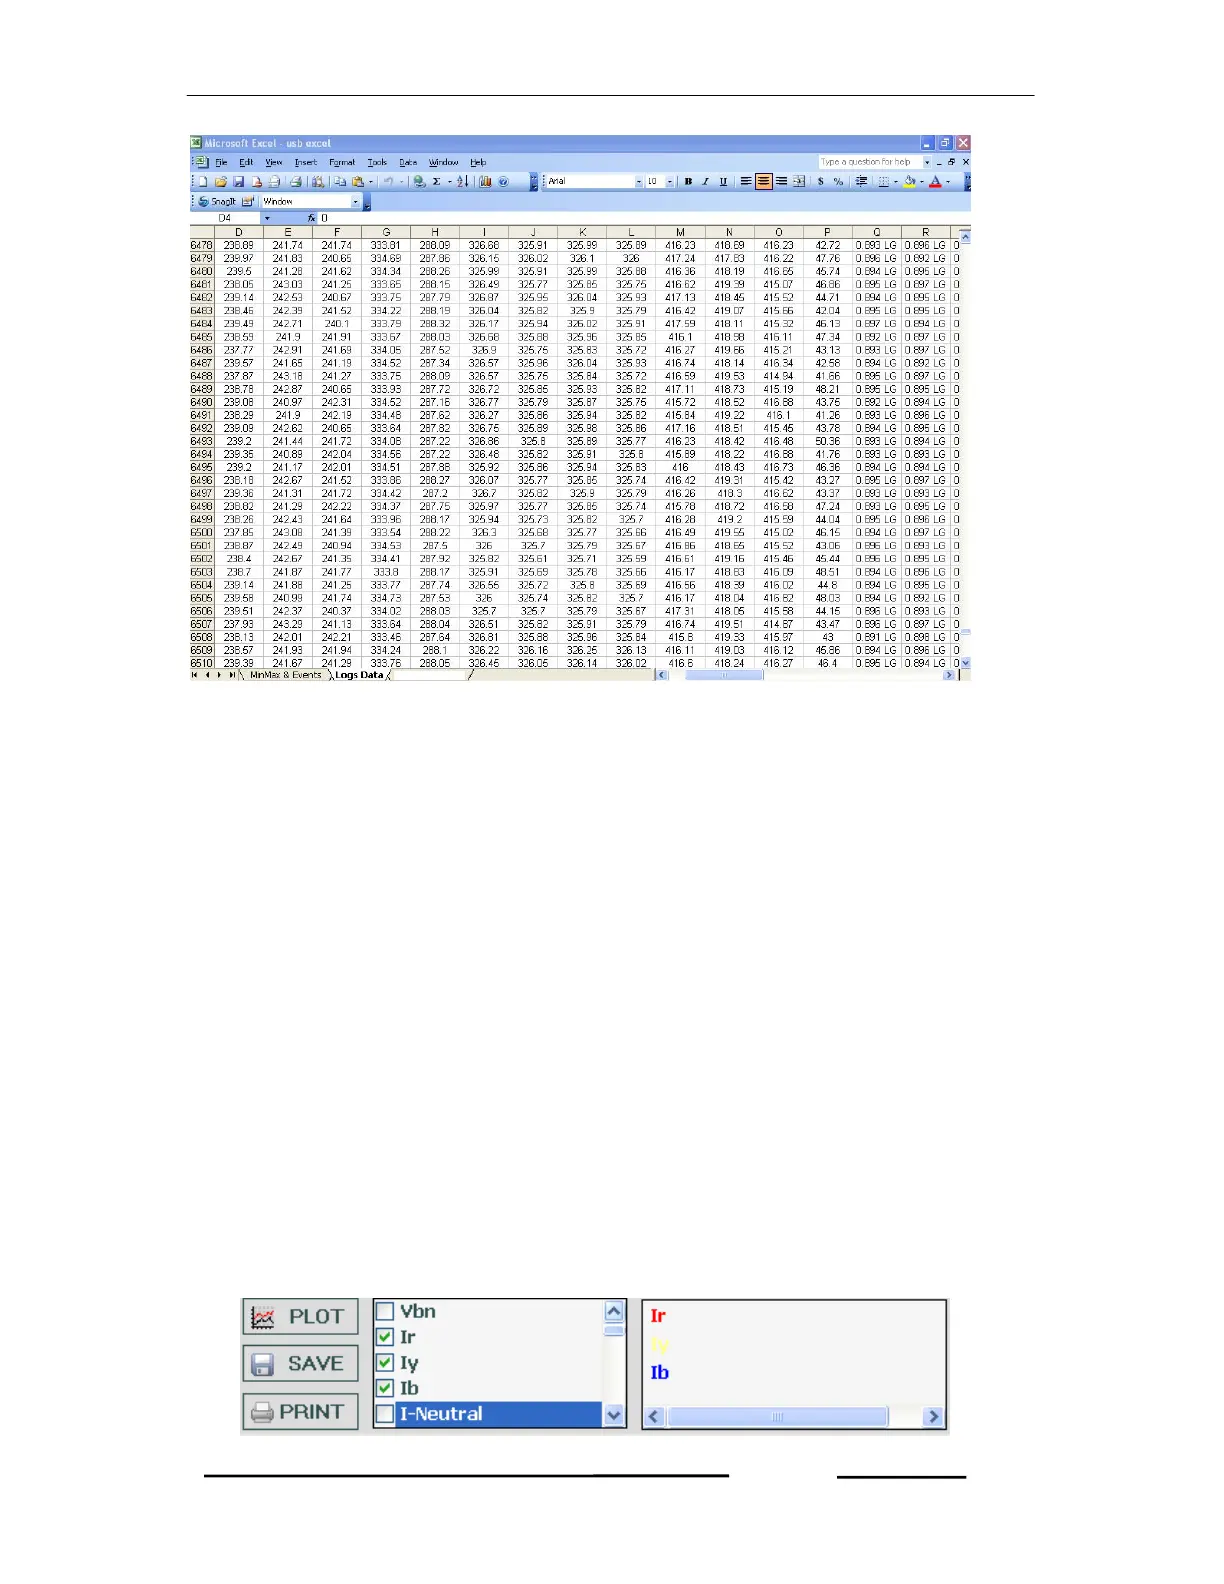
The graph plots for various selected parameters of Logged data including harmonics
distortion along with date and time. Hence, the back ground color, Axis colors and
Label colors can also be selectable.
Plotting a Graph for Logged data.
The logged data can be plotted to a graph with the selected parameters, date and
time.
To plot a graph, proceed the following instructions,
1. At the top of the Logger Windows, click Graph to show a graph window.
2. At the bottom of the graph window, enter starting date and time in the Start box,
enter ending date and time in End box under Date and Time. There are also
two types of Scale such as Auto scale and Manual scale. Auto scale is already
selected by default. For Manual scale requirement, select Manual scale.
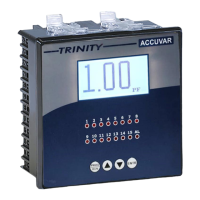
3. To select for the parameters to be plotted, double-click in check box which will
display the parameter selected at right side list with colors such as shown
below.