Revision C – January 2023
CDS2000 Page | 10
DisplayInformation
The CDS2000 has five primary displays. For example, under the Details screen there are five informative
screens that can be selected using PREVIOUS and NEXT. Pressing and holding the HOLD button will
keep the currently displayed screen from timing out. Please Note: when sub-menus are displayed, the
PREVIOUS and NEXT softkeys are used to scroll between screens.
PowerUpDisplay
The Turbines, Inc. logo is displayed for approximately 10
seconds while the operating system is loading in the
background.
OperatingDisplay
The Operating Display is what remains on the screen and
indicates all pertinent product delivery information. From
this display the setup or programming menu can be
accessed. See page 14 for more information regarding
Programming Mode. The setup menu accesses the
following sub-menus:
Language
Date/Time (Password Protected)
Hardware Configuration (User Password Protected)
Metrology Configuration (User Password Protected)
System Settings (User Password Protected)
Factory Setup (Privileged Password Protected)
Prove Mode (User Password Protected)
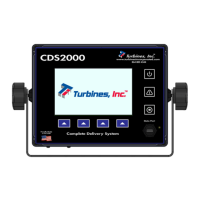
Customer’s Icon and Name: The icon is in the upper left corner of the display and can be
customized at the factory for an end user or OEM. The customizable icon must fit within the same
space that contains the existing TI CDS2000 Turbines Inc. message.
Time & Date: The current time and date as set by the system's real time clock (24-hr format or
12-hr format options). The colon separating the hours and minutes will flash once per second to
indicate that the system is functioning. If enabled the clock is automatically adjusted for
daylight savings time (DST) or standard time (NON-DST).
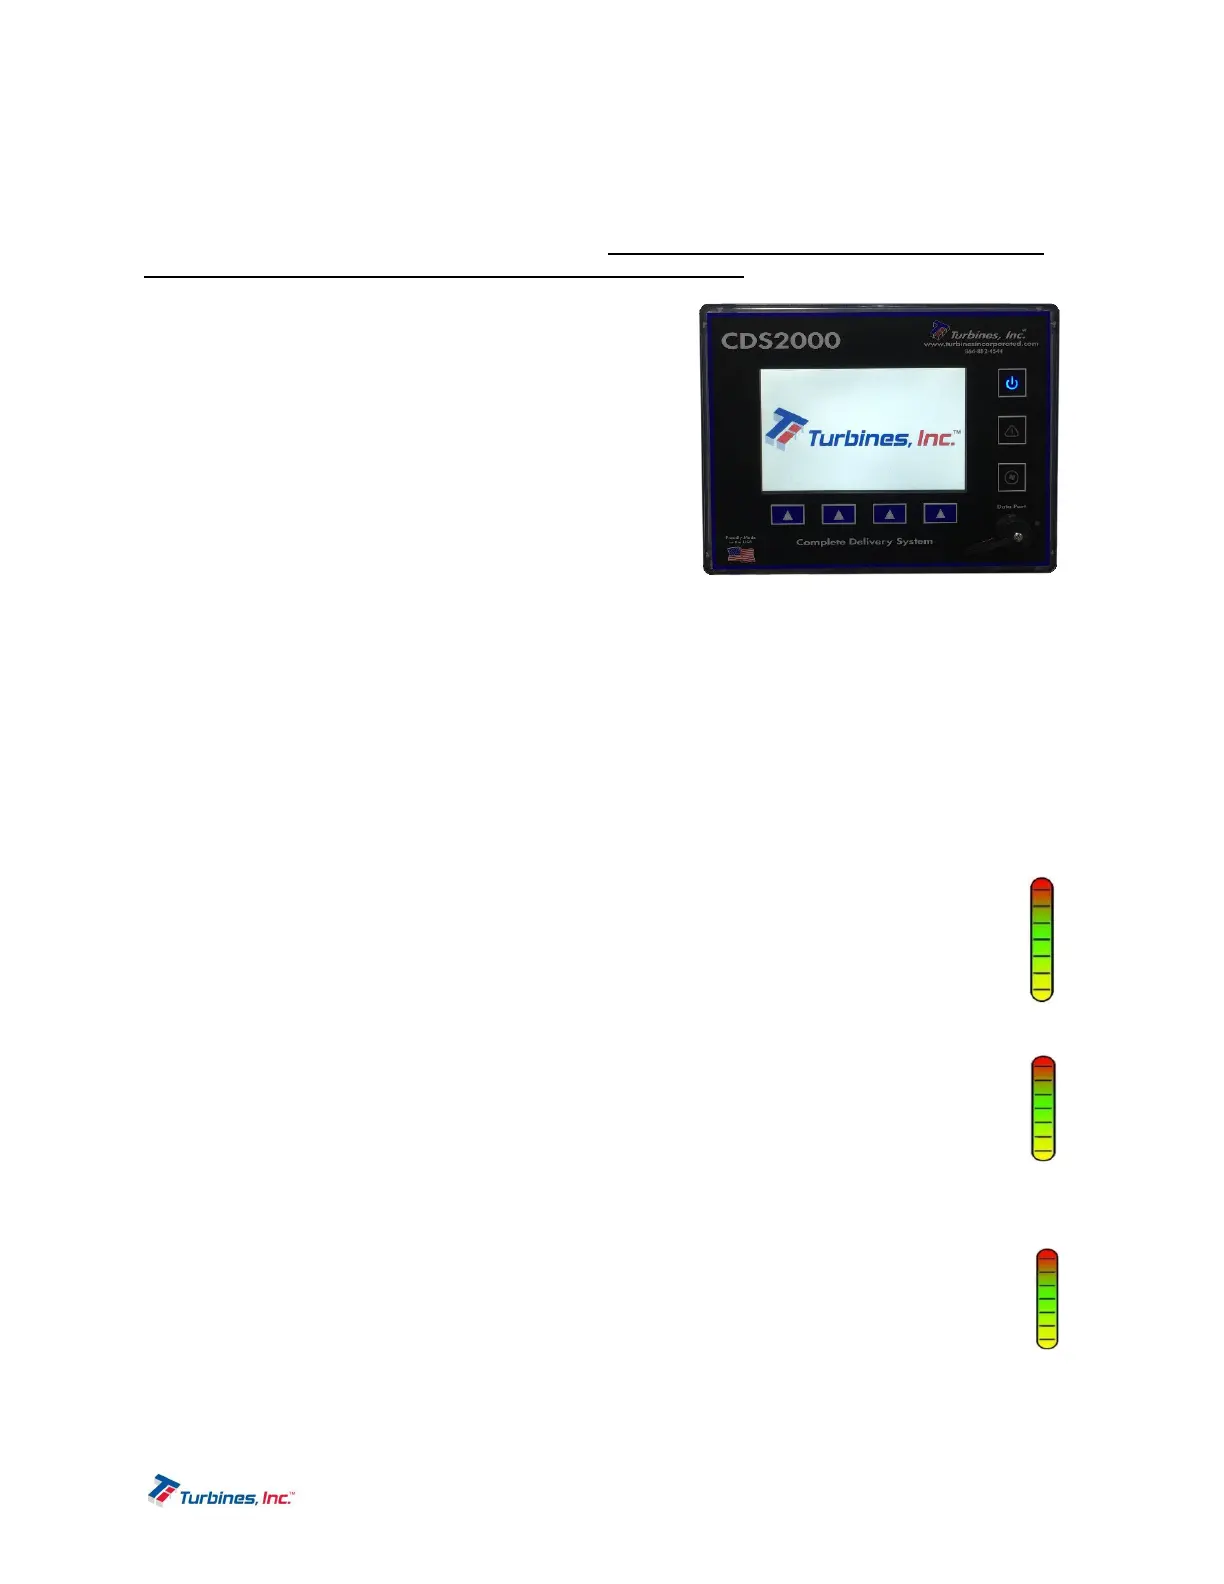
Pressure Bar Graph: The Pressure Bar Graph indicates either the process pressure of
the product or the pump discharge pressure. The range of the graph is automatically
configured using the Setup Menu ->Metrology Configuration (Page 21). The pressure
and unit of measure is displayed directly beneath the bar graph. The unit of measure
is configured in the Setup Menu and displayed below the bar graph. The pressure bar
graph is updated every second and if the delivery pressure is out of range, the
“PRES” descriptor above the bar graph will turn red, flash, and the red System Alarm
LED will flash.
Temperature Bar Graph: The Temperature Bar Graph indicates the process
temperature of the product being delivered in relation to the minimum and maximum
temperature limits automatically determined by the product being delivered. The
temperature and unit of measure is displayed directly beneath the bar graph. The unit
of measure is configured in the Setup Menu -> Metrology Configuration (Page 21) and
displayed below the bar graph. The temperature bar graph is updated every second and if the
temperature is out of range, the “TEMP” descriptor above the bar graph will turn red and
flash, and the red System Alarm LED will flash.
Flowrate Bar Graph: The Flowrate Bar Graph indicates the current flowrate of the
product being delivered in relation to the minimum and maximum flowrate. The min and
max limits are determined by the turbine flowmeter selected in the Setup Menu ->
Metrology Configuration (Page 21).
o The unit of measure is configured in the Setup Menu -> Metrology
Configuration (Page 21) and displayed below the bar graph. The Flowrate Bar Graph is
300
°F
0.0
PSIG
120