UHP SCPC MODEM
USER MANUAL, v3.2
© ROMANTIS 2015 38 www.uhp.net
7. OPERATION
Information on UHP router status is displayed in the different section of its WEB-interface:
Status bar;
Menu of commands;
Control panel.
7.1 Status Bar Statistics
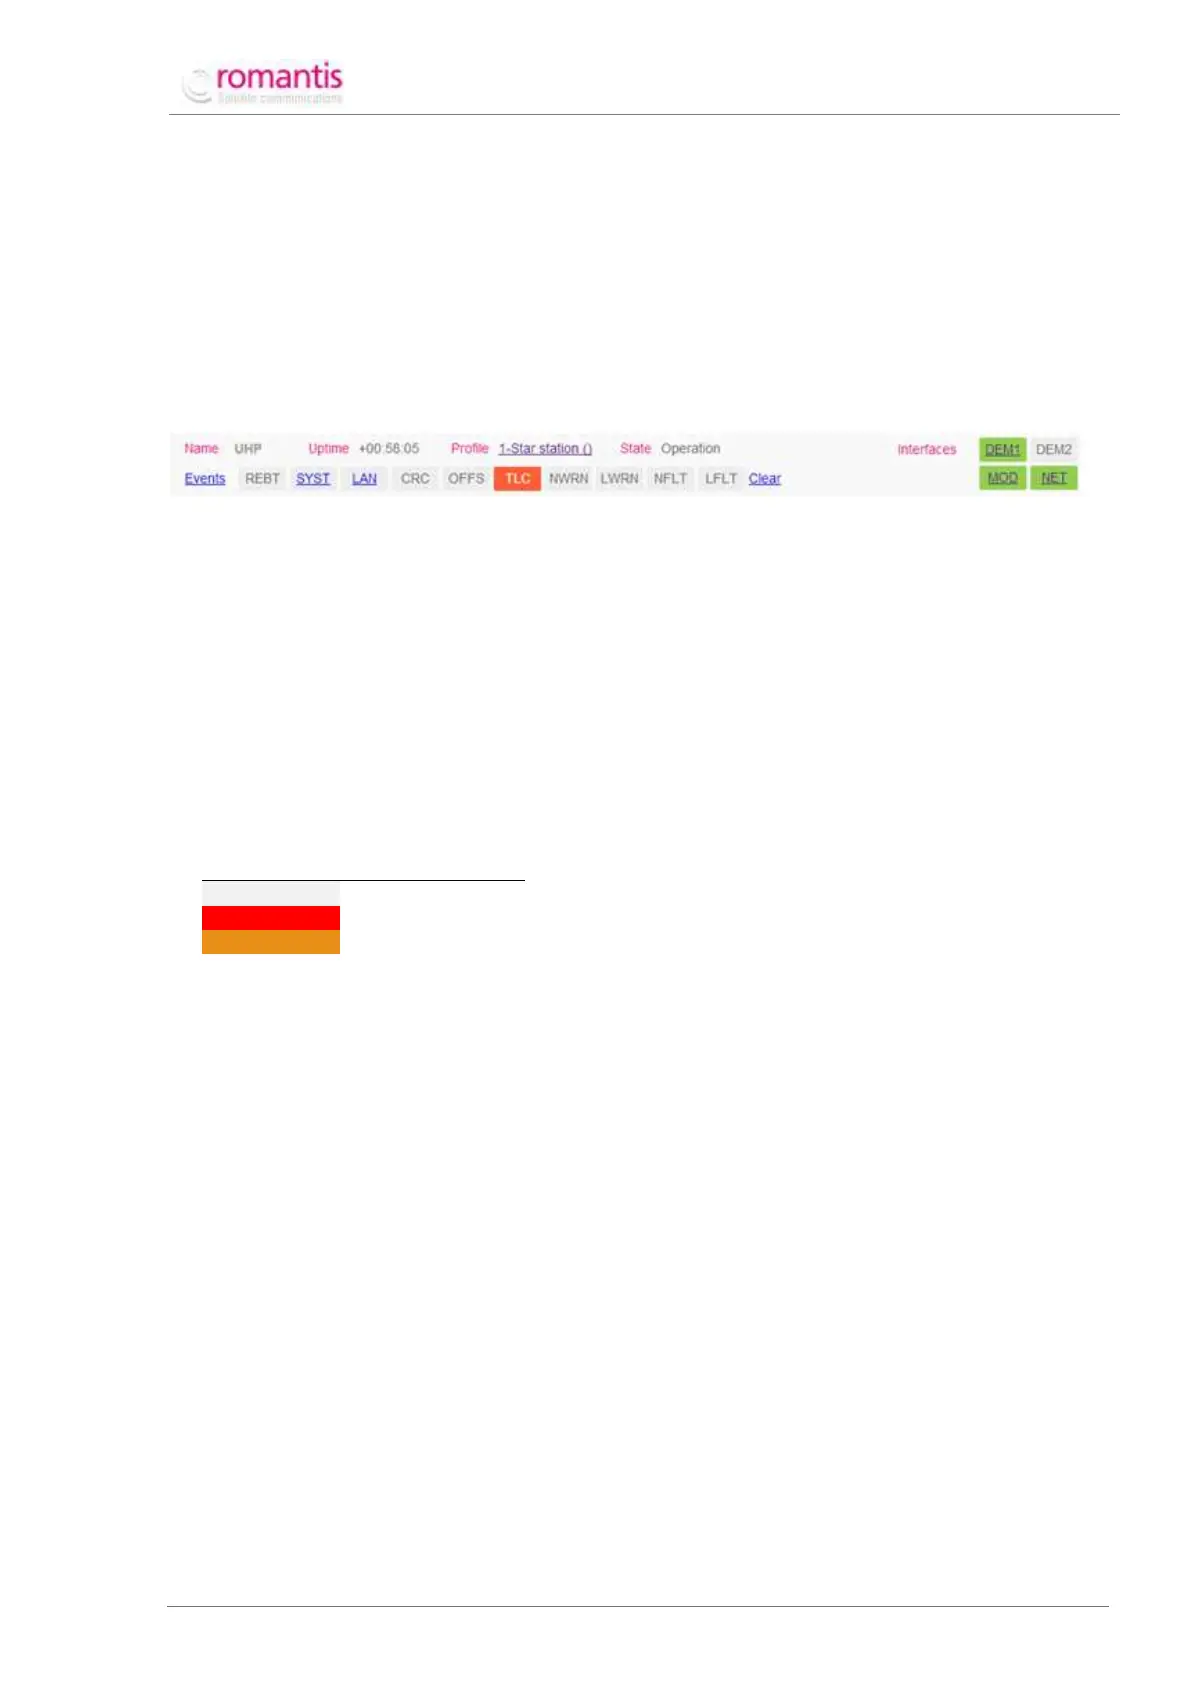
The information on router operation is given by the following elements of the Status bar (see Figure 42):
Figure 42 Status bar statistics
Where:
time since last reset of the router;
currently running profile;
Status of the interfaces (active interfaces are marked green).
The Status bar also displays markers informing on the events that occurred in the course of router operation. The
markers have three states which correspond to the following colors:
The markers indicate the following events or characteristics:
system faults (a click displays the information on the current status);
Status of the Ethernet interface (a click opens interface statistics);
maximum value achieved during the automated power adjustment (Max TLC TX level in
current profile settings).
Click Clear in the Status bar to clear all the registers.
7.2 Control Panel Statistics
To access the Control panel statistics switch to Overview section of the Menu of commands. The Control panel
displays the current statistics of UHP router operation and configured operating modes.
The screen is divided into several sections - the first three sections are always present other sections are displayed
only if certain modes of operation are on. For instance Figure 43 shows one additional section corresponding to
the redundant mode (Redundancy). Individual parameters are presented as links to the corresponding statistics
and configuration elements.