Temperature compensation correction
The Valmet TS compensates for the effect of temperat-
ure by using a temperature measurement. If temperat-
ure sensitivity is still observed in the measurement
result, it can be eliminated by temperature compensa-
tion correction. First determine the actual temperature
dependence by means of laboratory monitoring. To
ensure reliable results, both the sampling and laborat-
ory analyses must be accurate and reliable, and also
the temperature range must be wide enough.
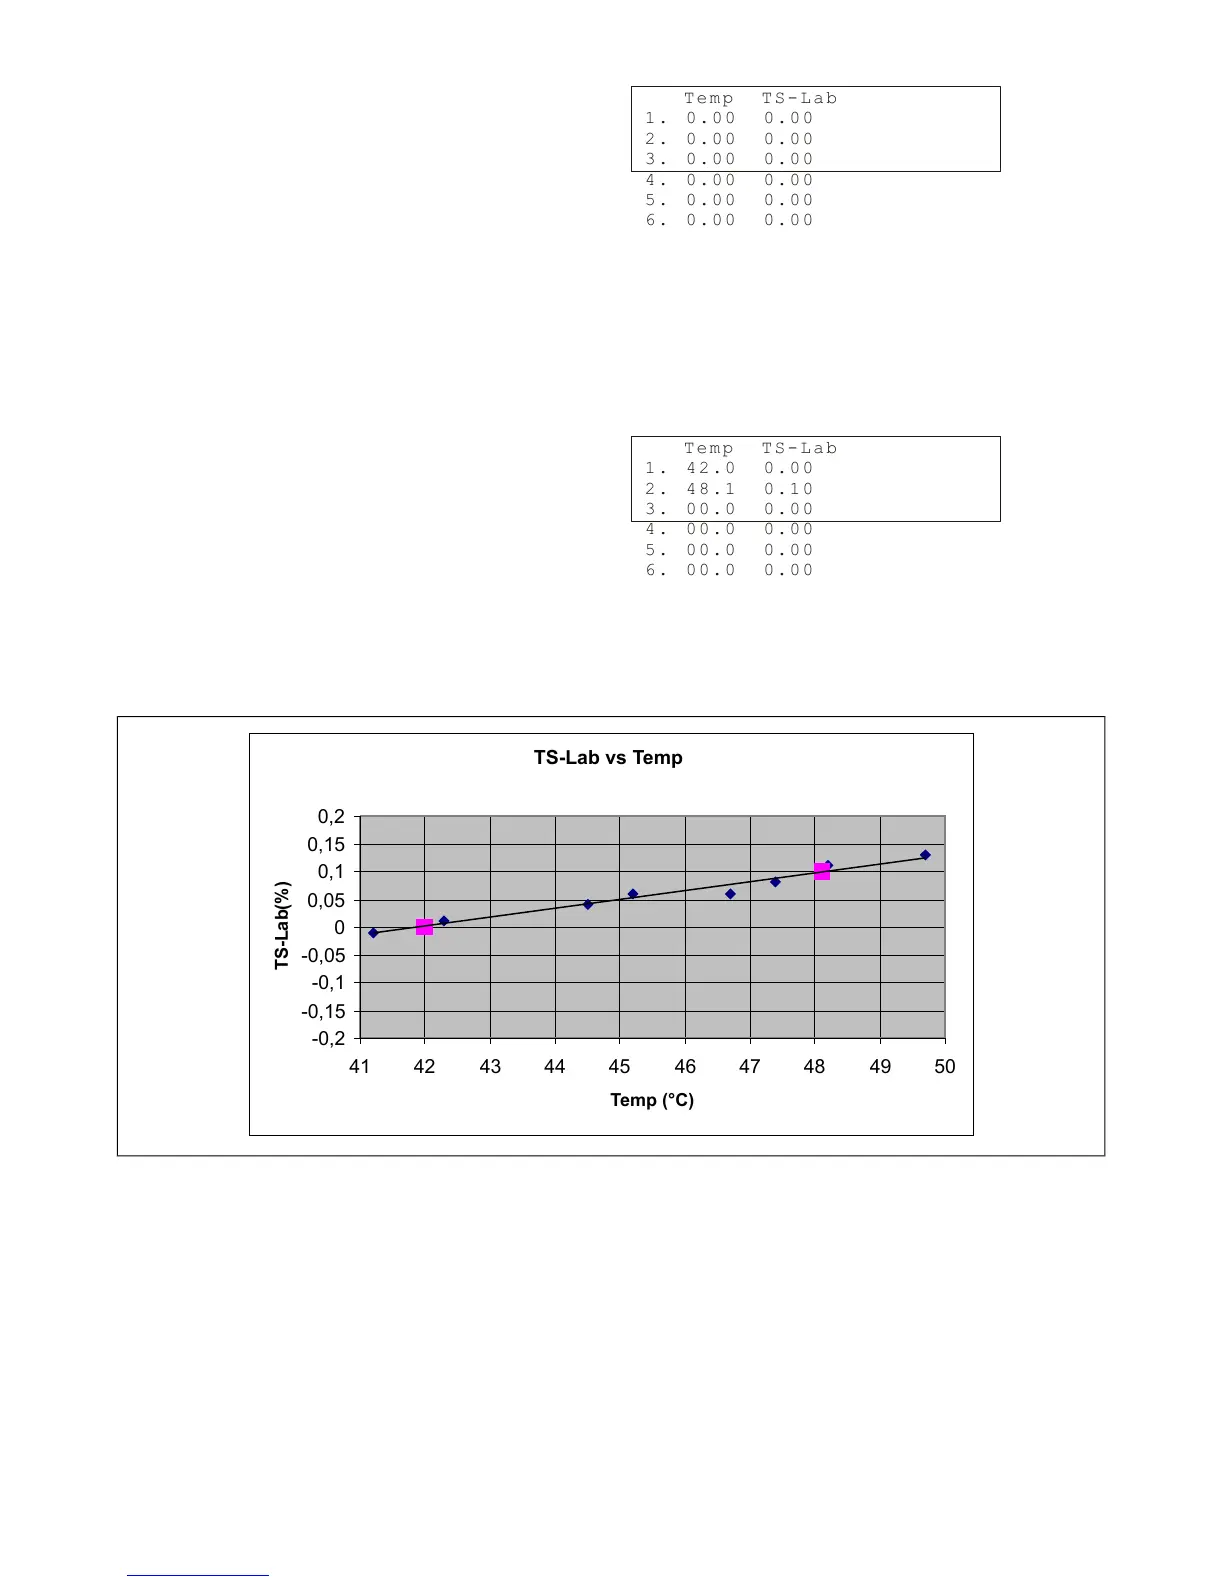
The results of laboratory monitoring are shown in a
TS-Lab vs. Temp graph. If the TS-Lab points are on a
horizontal graph, the Valmet TS measurement results
show no dependence on temperature. If the graph is
horizontal but are not at zero level, perform a level
correction to the calibration as instructed in section 7.3.
If the graph is not horizontal, the Valmet TS meas-
urement results show some dependence on temperat-
ure (Fig. 1). To eliminate this effect, enter a correction
curve for the temperature compensation. Select "Spe-
cial functions" -› "Temperature comp", and the following
display will appear:
Press "Edit/Save". Then enter the correction curve
as point pairs, Temp/TS-Lab. The Valmet TS will use
this data to correct the compensation. Up to six point
pairs can be entered. In the case shown in Fig. 1 two
point pairs are enough, and based on the results these
can be selected for example as follows:
Fig. 1. Determining temperature dependence.
Installation & Owner's manual, OUL00489 V2.3 EN
28
Valmet Total Solids Transmitter