Effect of new total solids calibration
If the Valmet TS is re-calibrated with a new total solids
content sample after setting the temperature compens-
ation correction, the device will make a level adjustment
to the correction curve.
This level adjustment sets the effect of the correction
curve to zero at the new calibration temperature. For
example, if a new total solids content calibration is
made using a 45 °C sample, the device will make an
approximately -0.05% level adjustment to the curve,
and the correction curve would then look like this.
T e m p T S - L a b
1 . 4 2 . 0 - 0 . 0 5
2 . 4 8 . 1 0 . 0 5
Changing the correction
If temperature dependence is still observed after the
correction, the easiest solution is to edit the existing
data points to correct the curve. The changes are then
added to the already existing correction values.
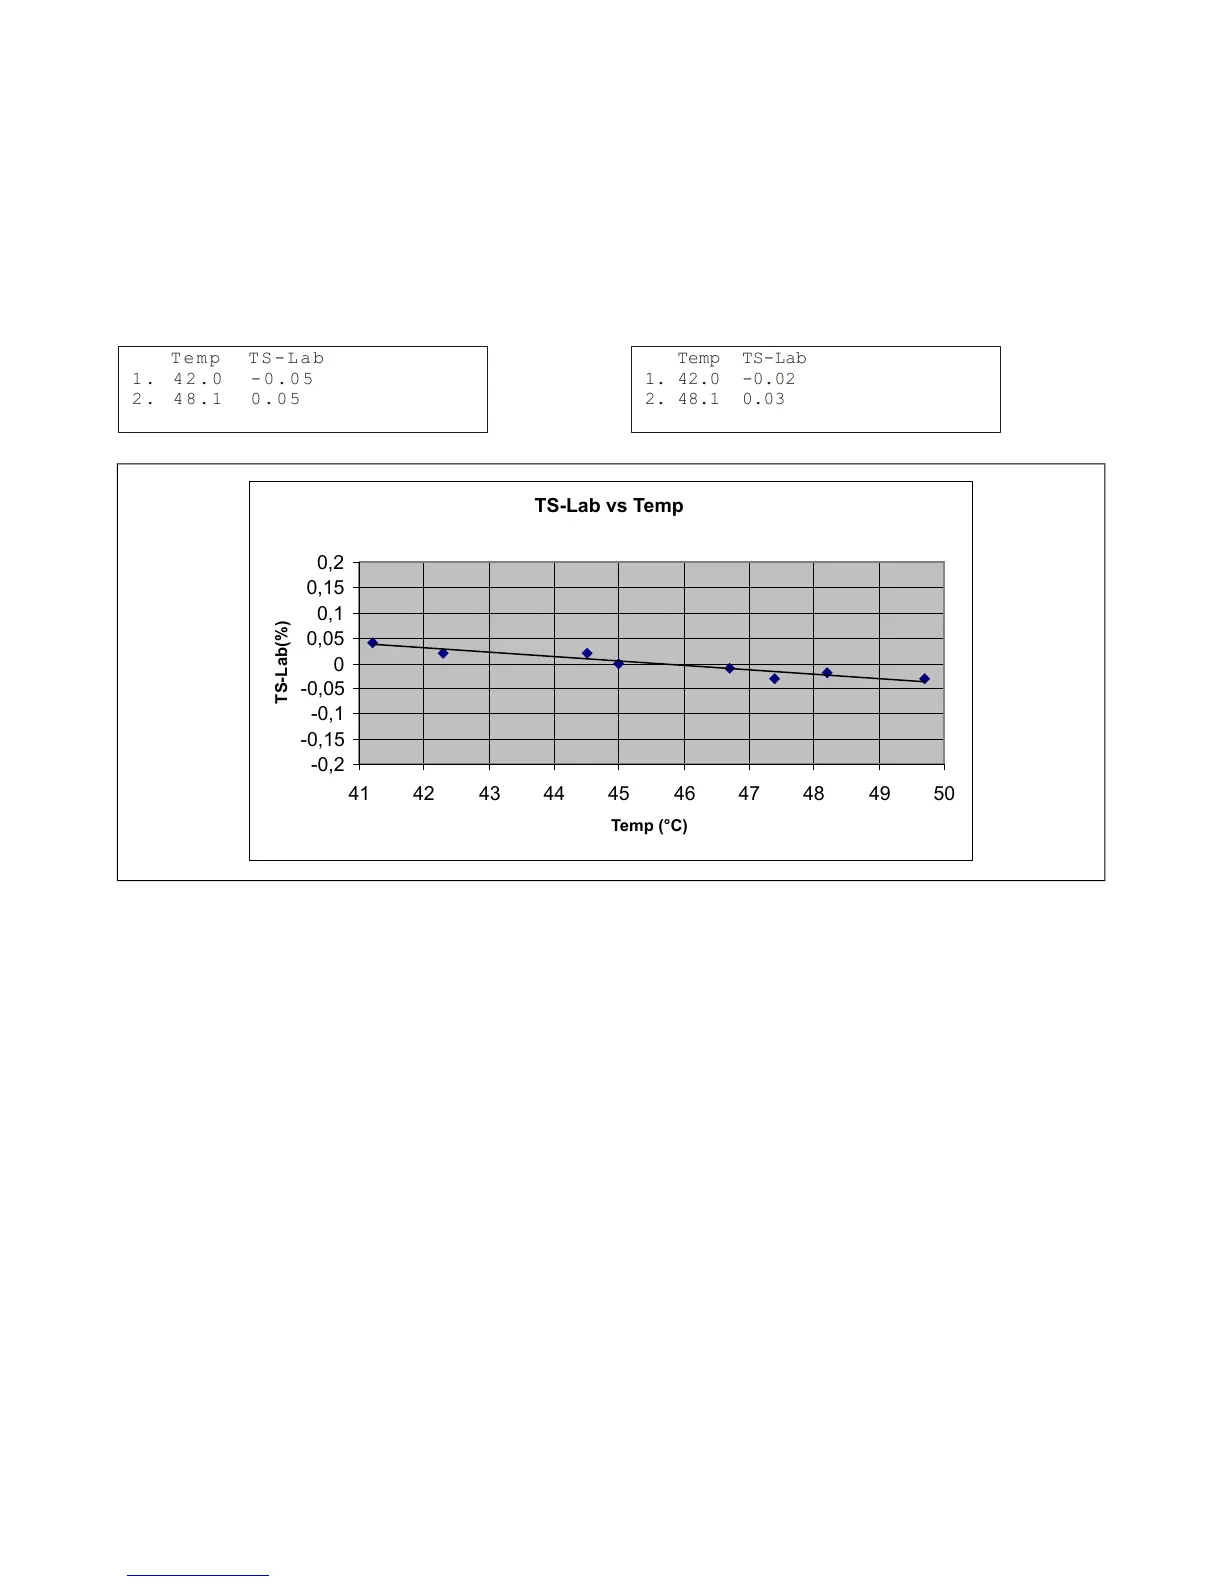
For example, after the temperature correction curve
and a new total solids content calibration, the results
would look like Fig. 2. The correction curve for 42°C
would be increased by 0.03%, and the correction value
for 48.1°C would be decreased by 0.02%, to give the
following correction.
Temp TS-Lab
1. 42.0 -0.02
2. 48.1 0.03
TS-Lab vs Temp
-0,2
-0,15
-0,1
-0,05
0
0,05
0,1
0,15
0,2
41 42 43 44 45 46 47 48 49 50
Temp (°C)
TS-Lab(%)
Fig. 2. Results of new total solids content calibration.
Installation & Owner's manual, OUL00489 V2.3 EN
29
Valmet Total Solids Transmitter