2-10 Installing the System
integrator or chart recorder plots the signal. The full-scale range of the chart
outputs is +10 mV full scale.
Tips:
• The integrator must invoke expanded memory to use the second channel
on the 746 integrator to plot pressure or percent composition. It plots the
second channel after the first channel finishes.
• The output signal reflects the solvent composition at the proportioning
valve, which differs from its composition inside the column or detector
cell.
Plotting
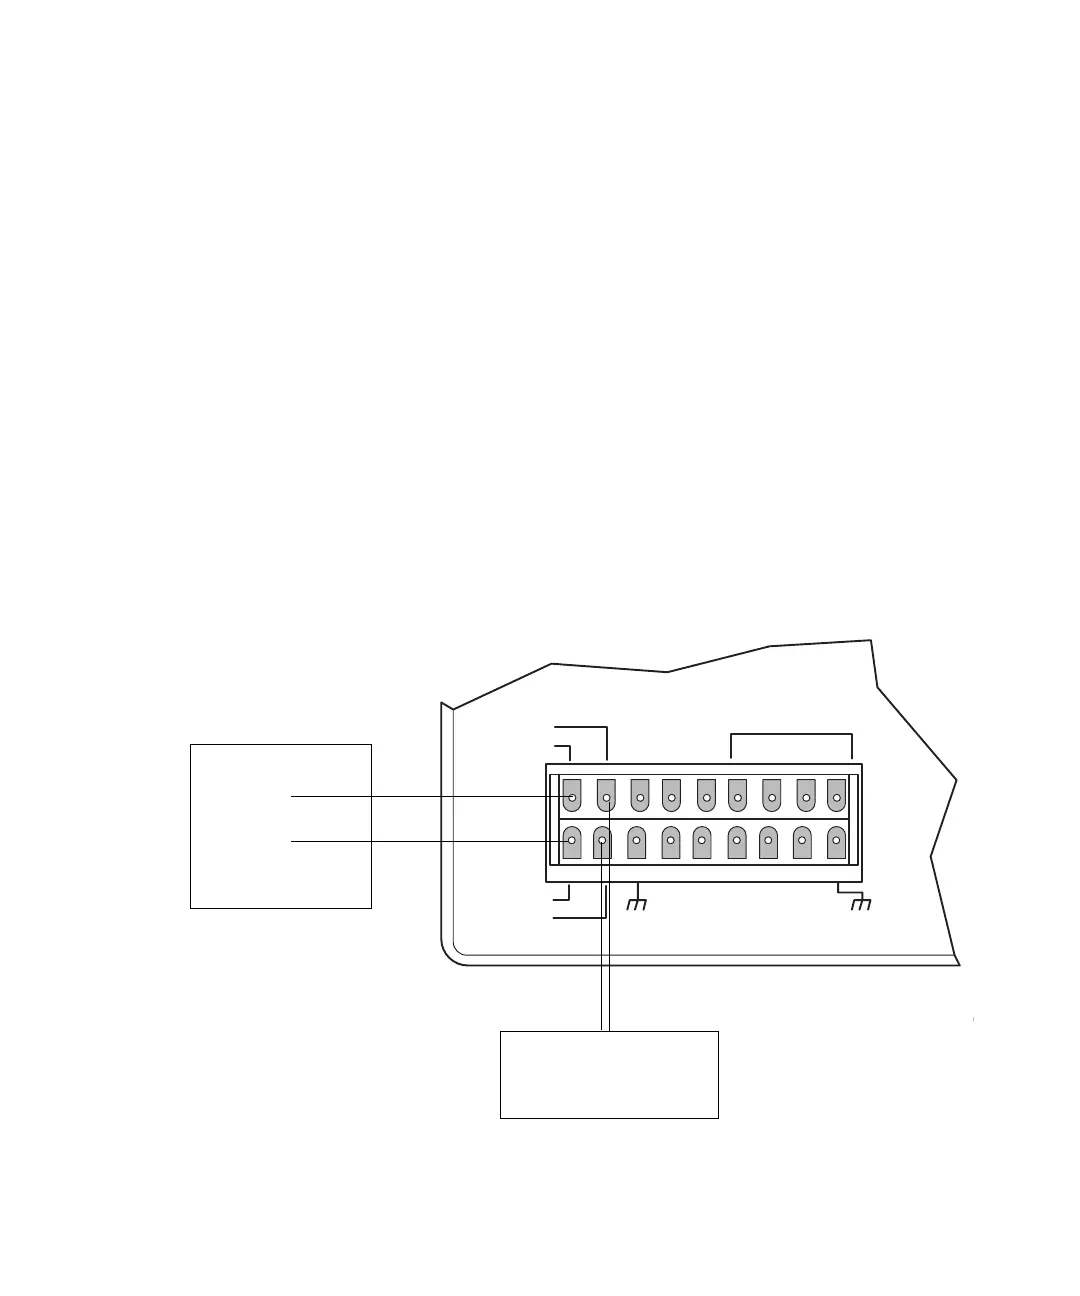
1. Connect the leads at one end of the event cable (Startup Kit) to the
Chart+ and Chart– terminals.
2. Connect the leads at the other end of the cable to the corresponding +/–
terminals for the second pen on the integrator or recorder.
Pressure and chart connections to the integrator or chart recorder
CHART +
PRESSURE +
CHART —
PRESSURE —
INJECT
STOP FLOW
HOLD
S1
S2
S3
S4
SWITCHES
GND
GND
GND
GND
AUX
+12V
+
–
Integrator or
chart recorder
Integrator or
chart recorder
second channel
Second channel