6.1.2 FFT mode - frequency domain measurements
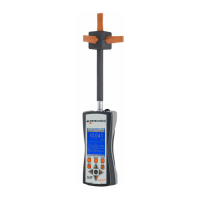
This function is only available with a selective probe, such as the WP400,
WP400-3, WPH-DC or theWP10M .
Frequency domain measurements contain frequency information on the
analysed field, obtained through calculation of the FFT of the signal.
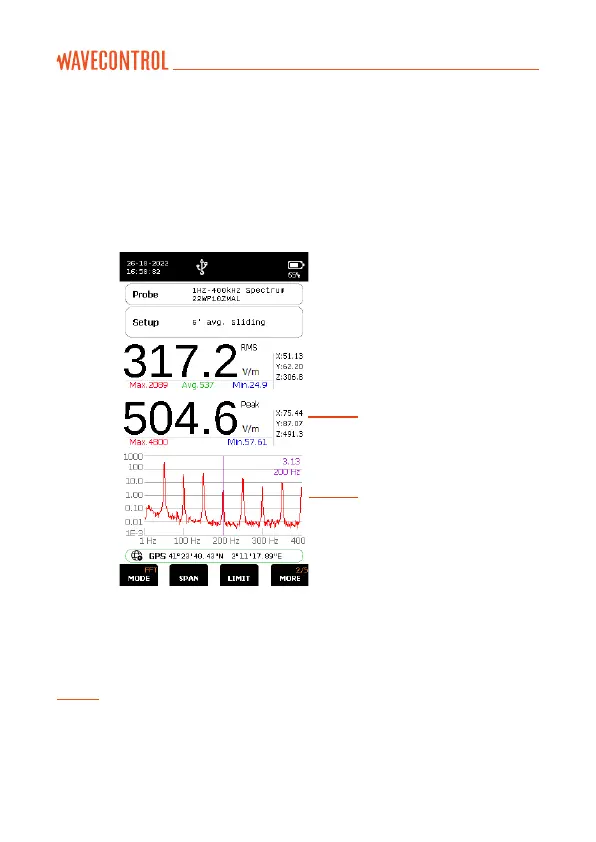
Total value (span independent)
RMS and Peak double display
FFT graph (span dependent)
Each frequency measurement (FFT) contains 400 points. The capacity of the
SMP3 allows storage of over 1,000 frequency measurements.
Note: In this mode the FFT graph is shown on the screen and you can use the cursor
to select a frequency. The total RMS and peak field values are shown above the graph.
Those values represent the whole field across the full bandwidth of the probe. The
selected span only affects the display of the FFT graph and does not affect the total
shown on the screen.