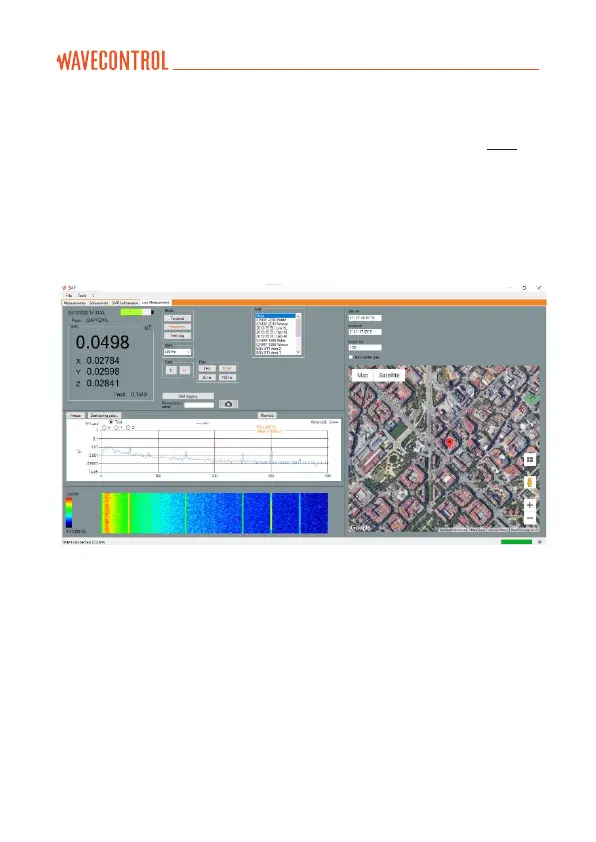
8.4. Live measurements
This screen is only available with a fibre optic connection (see section 4.3.2).
It provides a real-time display on your PC screen of the data being measured
by the SMP3. It also allows you to change settings for the device, such as:
• Measurement mode (Time, Frequency or Time at one frequency).
• Field type (electric or magnetic).
• Limit, span, filter (for WP400, WP400-3 and WP10M).
Figure 18: live screen
At the top on the left you will see the instantaneous field value for each
axis and, depending on which probe you are using, several options to
change measurement parameters.
You can start or stop logging data and take screenshots.
In the frequency mode, you will see a graph with the FFT of the signal. Click
on the graph to position the cursor, which will show the value for that
frequency.