Once the measurement behavior is defined, the next step is to choose the
“Time” option on the “MODE” dynamic menu (screenshot 1B).
To start the measurement, now all that you need to do is select “LOG” on the
dynamic menu (screenshot 1C).
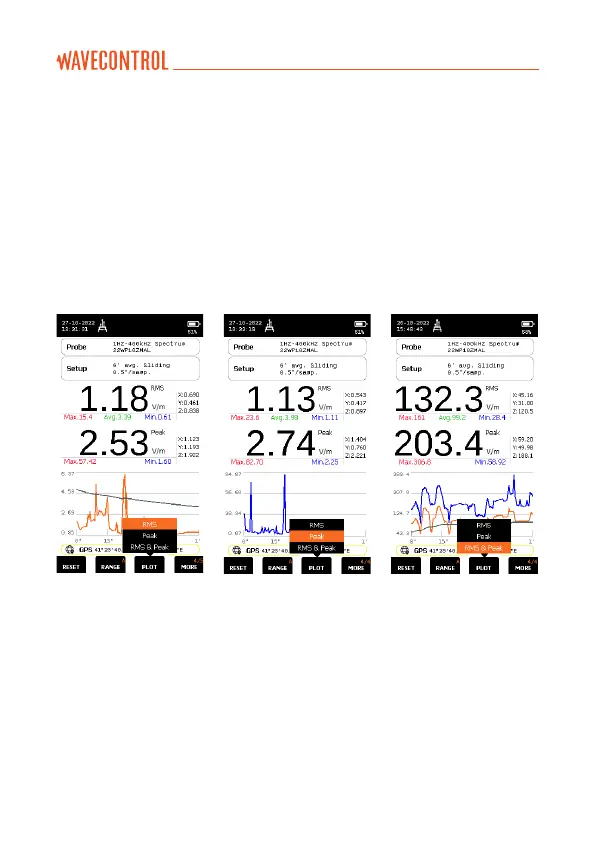
In time mode, the WP400, WP400-3, WP10M and WPH-DC (DC+AC or
AC) have a “PLOT” function in the dynamic menu, where the user can
select the RMS only (screenshot 1D) or Peak only (screenshot 1E) or both
RMS and Peak (screenshot 1F) plots.
Screenshot 1D Screenshot 1E Screenshot 1F
2. Selective measurement (FFT)
The SMP3 + WP400 (or WP400-3 or WPH-DC or WP10M) allows you to
make selective measurements by means of real-time FFT-based signal
analysis using digital signal processing techniques. This can be done for
both the E field and the H field, over different frequency spans: 40 Hz, 400 Hz,
4 kHz, 40 kHz or 400 kHz, 10 kHz, 100 kHz, 1 MHz or 10 MHz (depending on
the probe):
• WP400 and WP400-3: 400 Hz, 4 kHz, 40 kHz or 400 kHz (E and H)
• WPH-DC: 40 Hz, 400 Hz, 4 kHz, 40 kHz (H field only)
• W10M: 10 kHz, 100 kHz, 1 MHz, 10 MHz (E and H).