CMP100 User Guide
53
The cluster menu displays the Status, Communications Topology, Node Settings and
Run Logs all related to the interconnections of the servers that are needed in achieving
certain number of requirements such as maximum number of programs and subscribers.
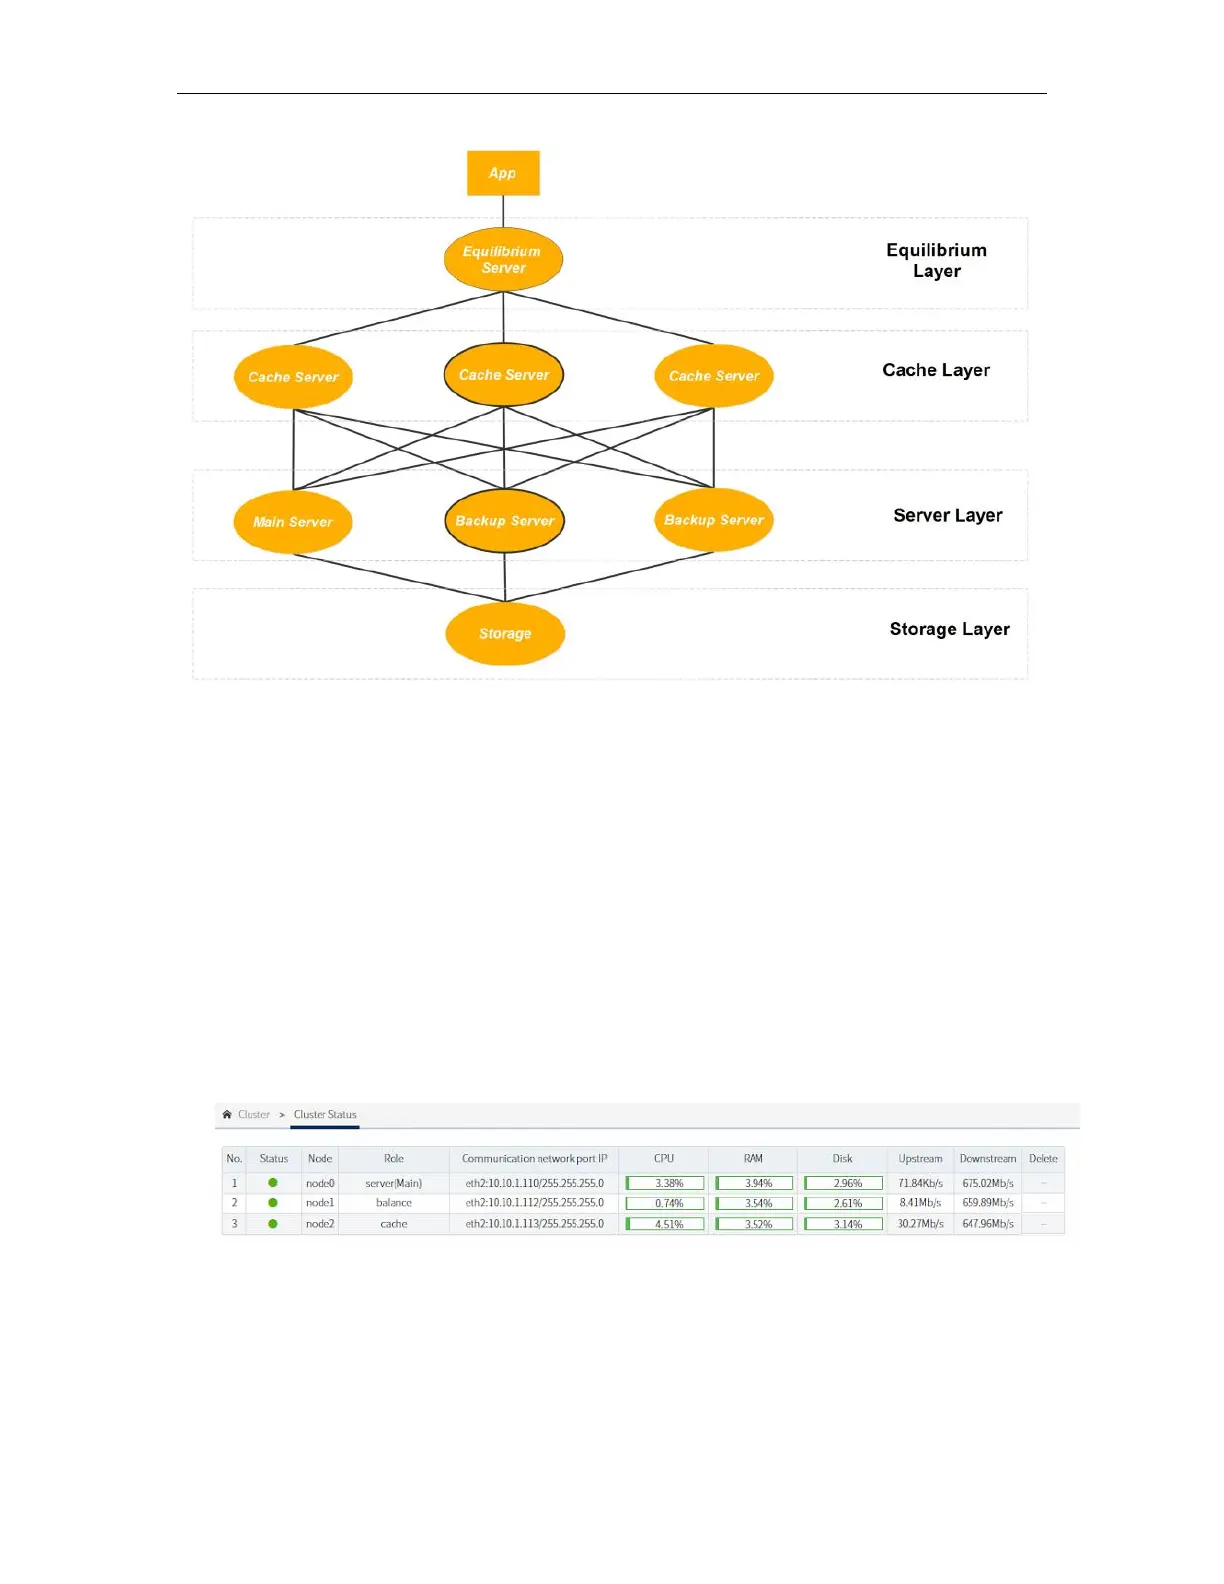
3.9.1 Cluster Status
This submenu shows the communication status of each server. A green indicator under
the status means that the connection is established. The CPU, RAM and Disk utilization
is also displayed together with the upstream and downstream bitrate.
3.9.1 Cluster Topology
Take for example a scenario when the a cluster involves three nodes or servers, one (1)
Main Server, one (1) Cache Server, and one (1) Load Balancing Server. The following
diagram represents the cluster with the assigned ports: