MC96F6432
June 22, 2018 Ver. 2.9 55
7.24 Typical Characteristics
These graphs and tables provided in this section are only for design guidance and are not tested or guaranteed.
In graphs or tables some data are out of specified operating range (e.g. out of specified VDD range). This is only
for information and devices are guaranteed to operate properly only within the specified range.
The data presented in this section is a statistical summary of data collected on units from different lots over a
period of time. “Typical” represents the mean of the distribution while “max” or “min” represents (mean + 3σ) and
(mean - 3σ) respectively where σ is standard deviation.
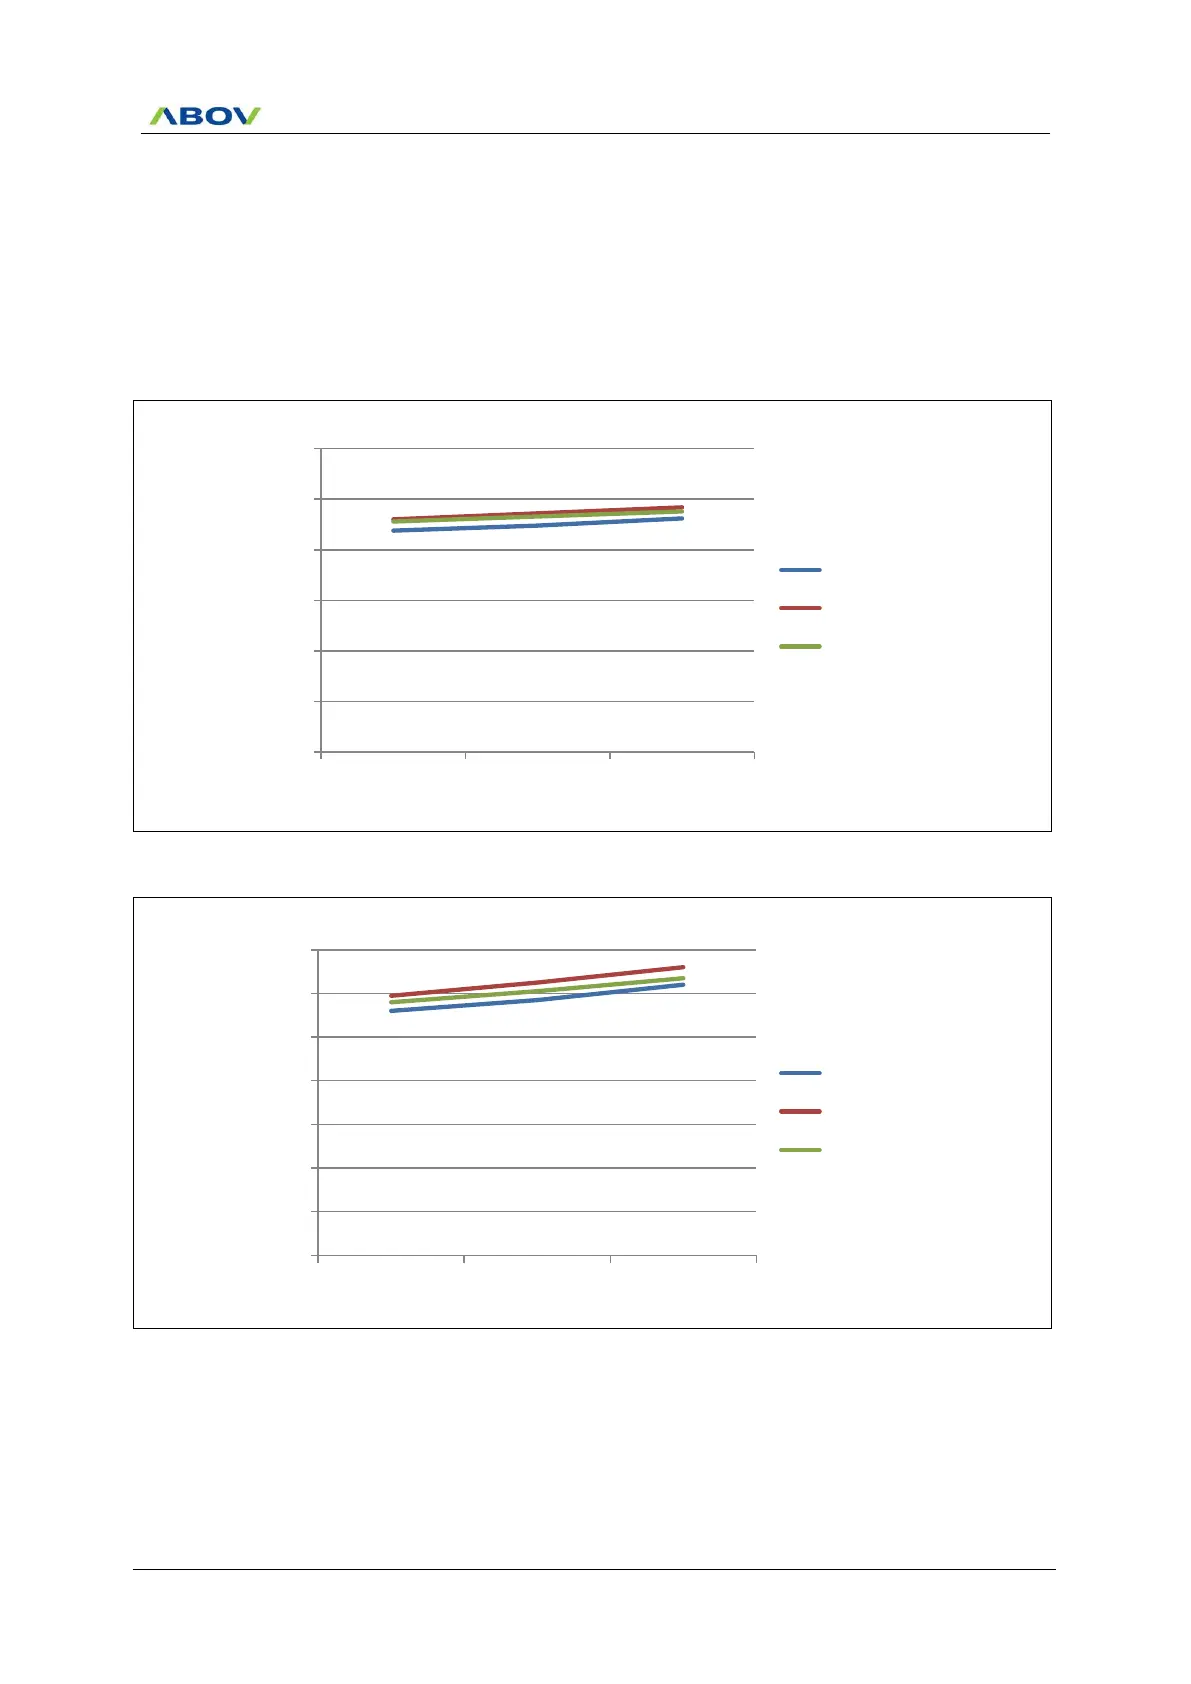
Figure 7.17 RUN (IDD1 ) Current
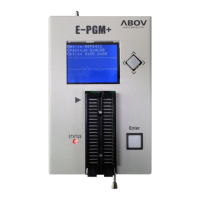
Figure 7.18 IDLE (IDD2) Current
0.00
0.50
1.00
1.50
2.00
2.50
3.00
2.7V 3.0V 3.3V
mA
10MHz -40℃
10MHz +25℃
10MHz +85℃
0.00
0.20
0.40
0.60
0.80
1.00
1.20
1.40
2.7V 3.0V 3.3V
mA
10MHz -40℃
10MHz +25℃
10MHz +85℃