Accsense VersaLog Data Loggers User’s Manual Page 62
Tool bar buttons:
Show List
Click to show/hide the list view panel.
Show Graph
Click to show/hide the chart view panel.
Vertical
Click to display the chart and list views vertically.
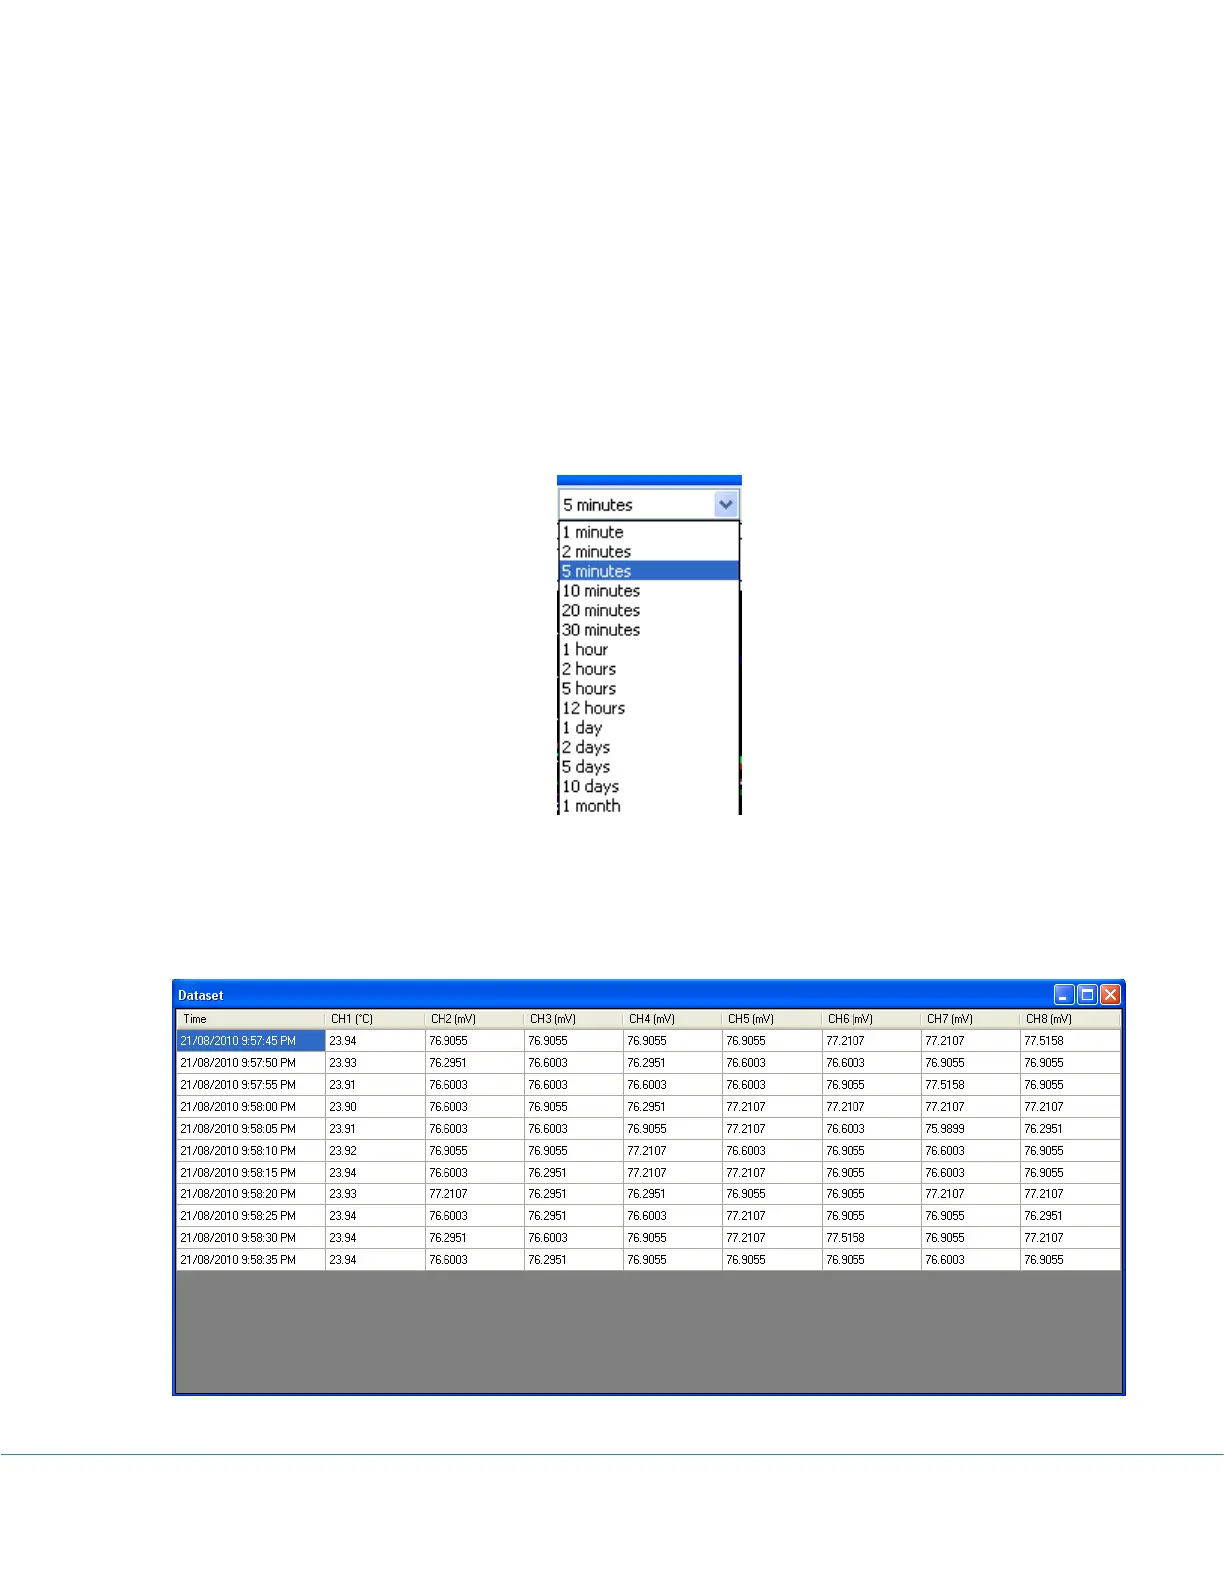
Time Span
This field allows changing the time span for the chart view. Available settings are:
Dataset
Click to display the tabular view of the recorded measurements illustrated below: