Chapter 6: Viewing Test Results and System Data
OsmoPRO MAX Automated Osmometer User Guide
57
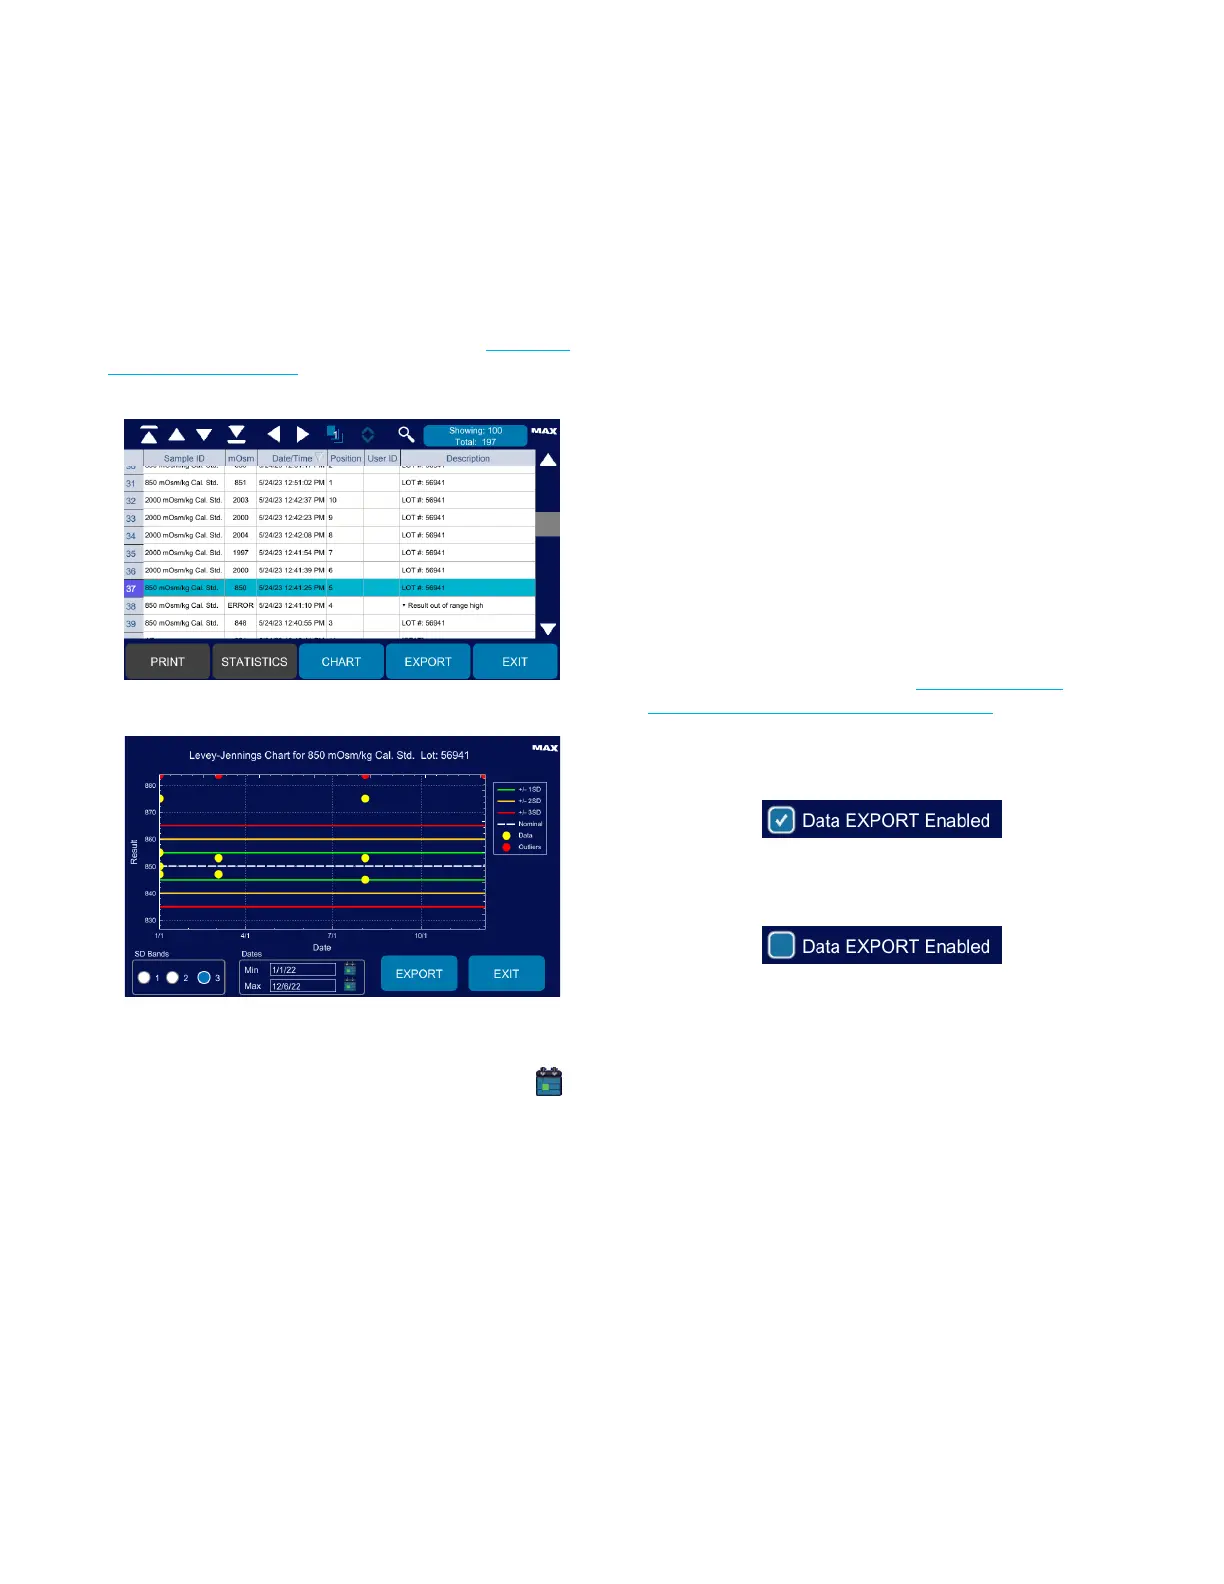
Displaying and Exporting a Levey-Jennings Chart
The OsmoPRO MAX can generate a Levey-Jennings
chart for controls with standard deviation (SD) bands
that are entered in the controls database (seeUsing the
Controls Log Database).
1. Select a test result on the Results screen.
2. Press Chart.
3. Select 1, 2, or 3 SD Bands.
4. Select a date range using the Min and Max calendars ( ).
5. Press Export to export the chart image to a USB
drive.
6. When you have finished viewing (and/or exporting)
the chart, press Exit to close the chart and return to
the Results screen.
6.6 Configuring Data Management
The Data Management screen provides access to
Supervisor-level utilities. From here, Supervisors can
enable/disable the exporting test results from the
Results screen and the exporting of system events from
the Diagnostics > Events screen.
Supervisors can also exports results, events, users, and
control logs data stored on the instrument in CSV format
to a USB drive.
The Data Management screen is available only to
Supervisor-level users.
Configuring Data Export of Results and Events
To configure the exporting test results from the Results
screen and the exporting of system events from the
Diagnostics > Events screen (see Exporting Results,
Viewing and Exporting Instrument Events):
• To enable exporting results and events from these
screens, press to select the Data Export Enabled
checkbox.
• To disable exporting results and events from these
screens, press to deselect the Data Export Enabled
checkbox.