8 Meadowbank Road, Carrickfergus, BT38 8YF, Northern Ireland www.advancedsensors.co.uk
Page 39 of 93
OIW-HBO-0002-EX-005
OIW EX SERIES-SIDE STREAM
OPERATION MANUAL
Rev. 004 MAY 2015
3.2.3.1.1.2 – Water Line Options
The ‘Water line’ refers simply to the process line currently being analyzed. The OIW analyzer has the capacity to analyze
multiple process water lines; in this case each ‘Water Line’ will be numbered and have unique configuration settings
optimized for the oil type being analyzed.
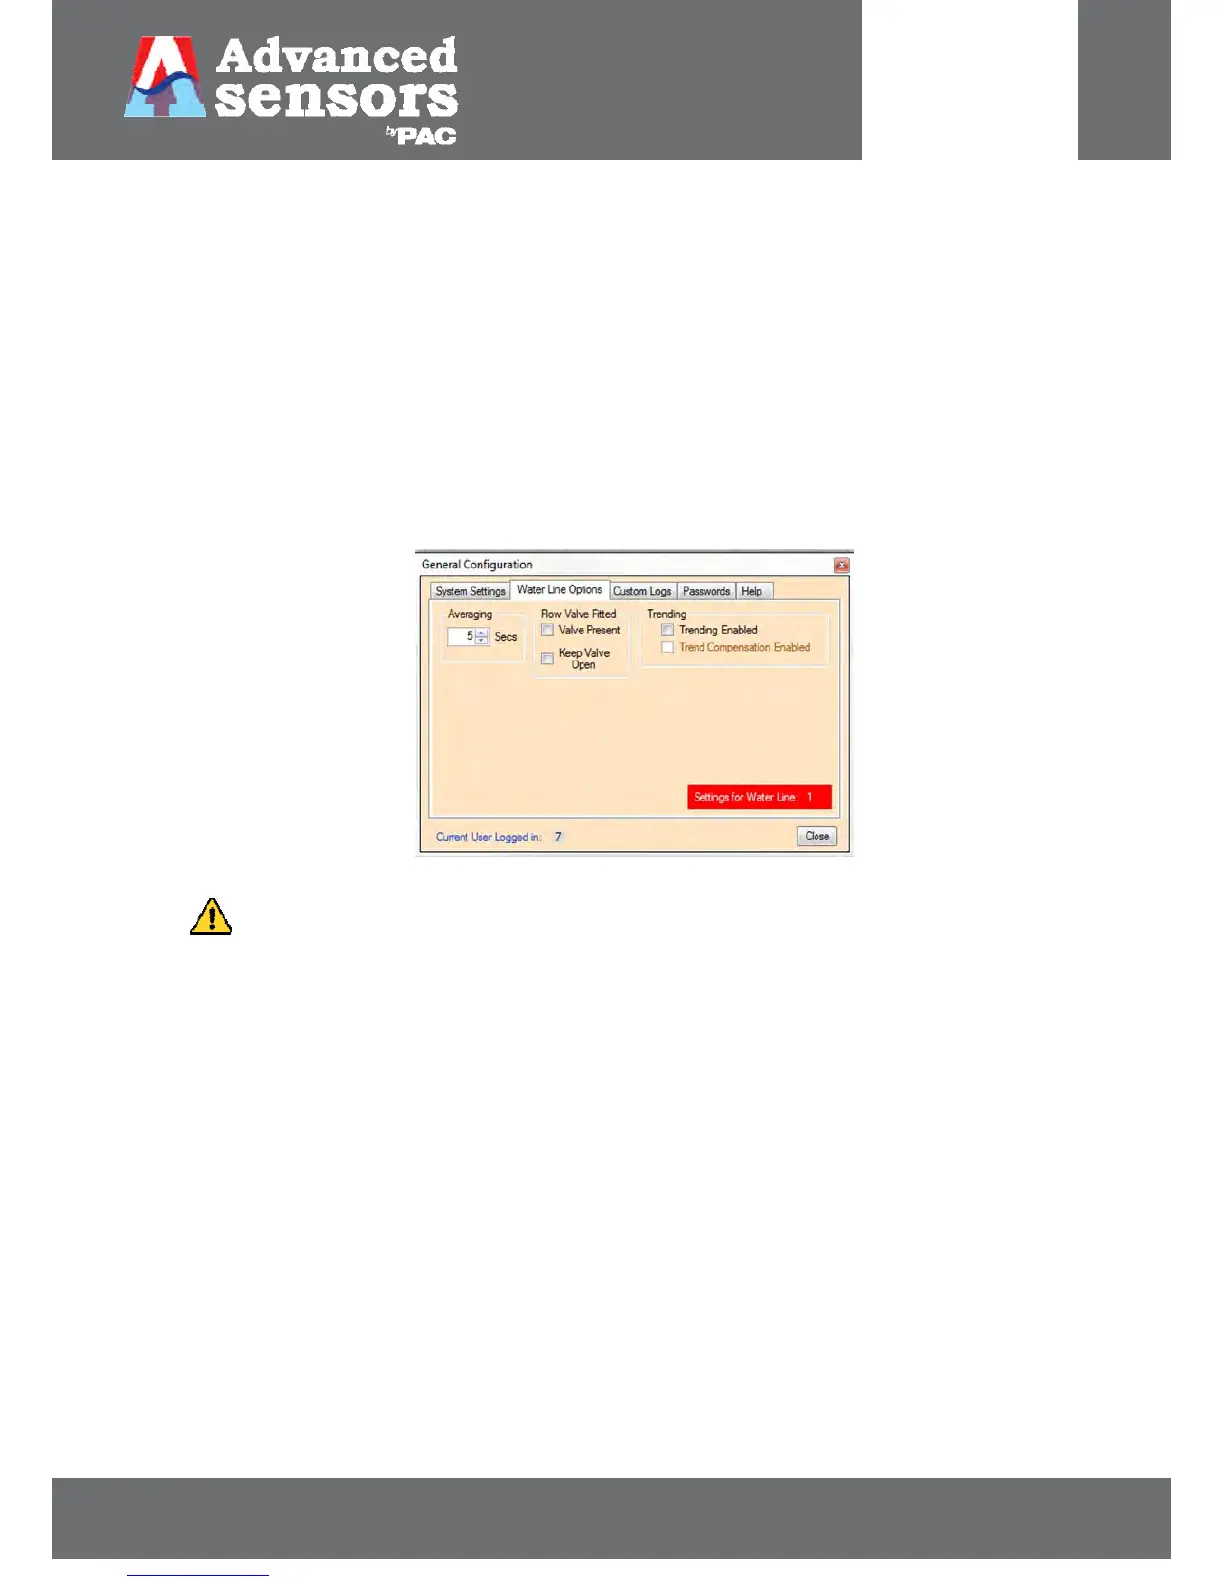
From the Water Line Options menu users can configure averaging time, valve status and trending for a given waterline.
Multiple waterlines, if present, can also be adjusted individually.
The measurement reading by default is not averaged and is normally displayed second by second. From this menu, in
Figure 44, the user can adjust the averaging display time, in seconds, for reading measurements. This will avoid the
appearance of continual fluctuations in the measurement reading display.
Figure 44: Water Line Options menu.
NOTE: Averaging only affects the reading on screen and on the 4-20 mA line, but does not affect the
reading sent to the data log file and does not alter the Flu reading on the system display area or
within the file.
Flow valves are typically fitted as standard to control the process water flow through the chamber assembly enabling
sample isolation for analysis. Selecting the ‘Valve Present’ box indicates that a flow valve is in use. If the valve is not in
use (deselecting ‘Valve Present’), users can select to ‘Keep Valve Open’, where an electrical signal is sent to maintain the
valve in an open state. However once the measurement cycle is started the valve will close and proceed as normal.
Trending options for measurement data, when enabled, include a trend line connecting data points on the graphical
display and trend compensation. Figure 45 shows when the ‘Trending Enabled’ box is selected the trend line connecting
each measurement data point is displayed on the graph. Once ‘Trending Enabled’ is selected the trend compensation
option becomes available.
 Loading...