8 Meadowbank Road, Carrickfergus, BT38 8YF, Northern Ireland www.advancedsensors.co.uk
Page 28 of 93
OIW-HBO-0002-EX-005
OIW EX SERIES-SIDE STREAM
OPERATION MANUAL
Rev. 004 MAY 2015
3.2.1 – Upper Panel: Feedback Display
The Feedback Display provides the user with system information. The function of this area is to clearly and simply
display the measurement reading, system status and alarm indicators for users. The following section will outline the
purpose and functional information of each component making up this display area. Figure 27 below denotes each
component covered in this section.
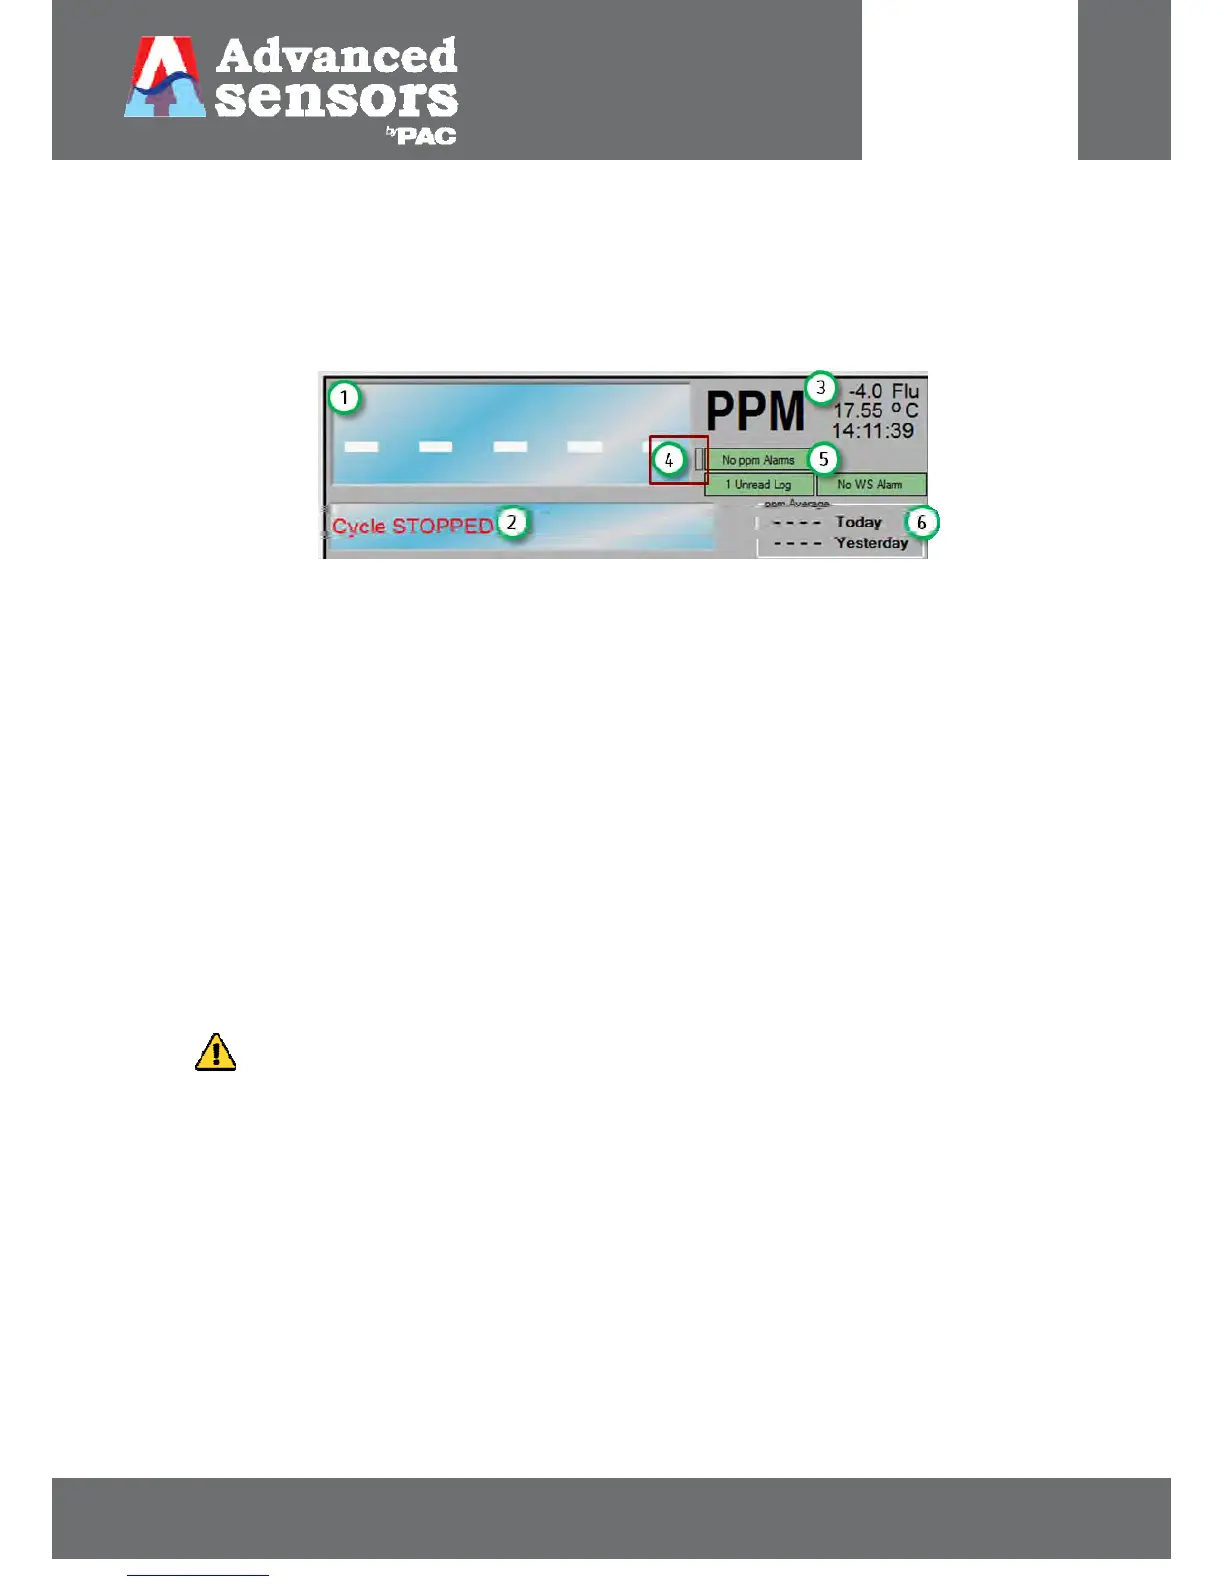
Figure 27: Feedback Display Area.
1. Measurement Reading, 2. System Status, 3. System Data, 4. Reading Menu 5. Alarm Indicators,
6. Measurement Average
3.2.1.1 – Measurement Reading Area
This blue window displays the measurement reading value. The reading value will normally be displayed as black text
during routine operation. If the measurement value exceeds the upper calibration limit the reading will turn red and
display the fixed value of the upper limit. The numerical display will be to 2 decimal places for readings below 10, to 1
decimal place for readings between 10 and 100 and whole numbers only for readings above 100 to the upper limit.
3.2.1.2 – Status Display
Below the ‘Measurement Reading’ area, the ‘Status Display’ indicates system information, such as the current
measurement cycle and respective time counter. Cycle phases, as described in Section 2.2 – Overview of Measurement
Cycle, for the EX systems include: Stopped, Valve Opening, Flowing, Cleaning, Valve Closing, Measuring and Auto-Tune.
NOTE: During routine operation the status display text will be BLACK, however when the system has been
manually stopped the text will flash RED and WHITE alternately.
 Loading...