8 Meadowbank Road, Carrickfergus, BT38 8YF, Northern Ireland www.advancedsensors.co.uk
Page 27 of 93
OIW-HBO-0002-EX-005
OIW EX SERIES-SIDE STREAM
OPERATION MANUAL
Rev. 004 MAY 2015
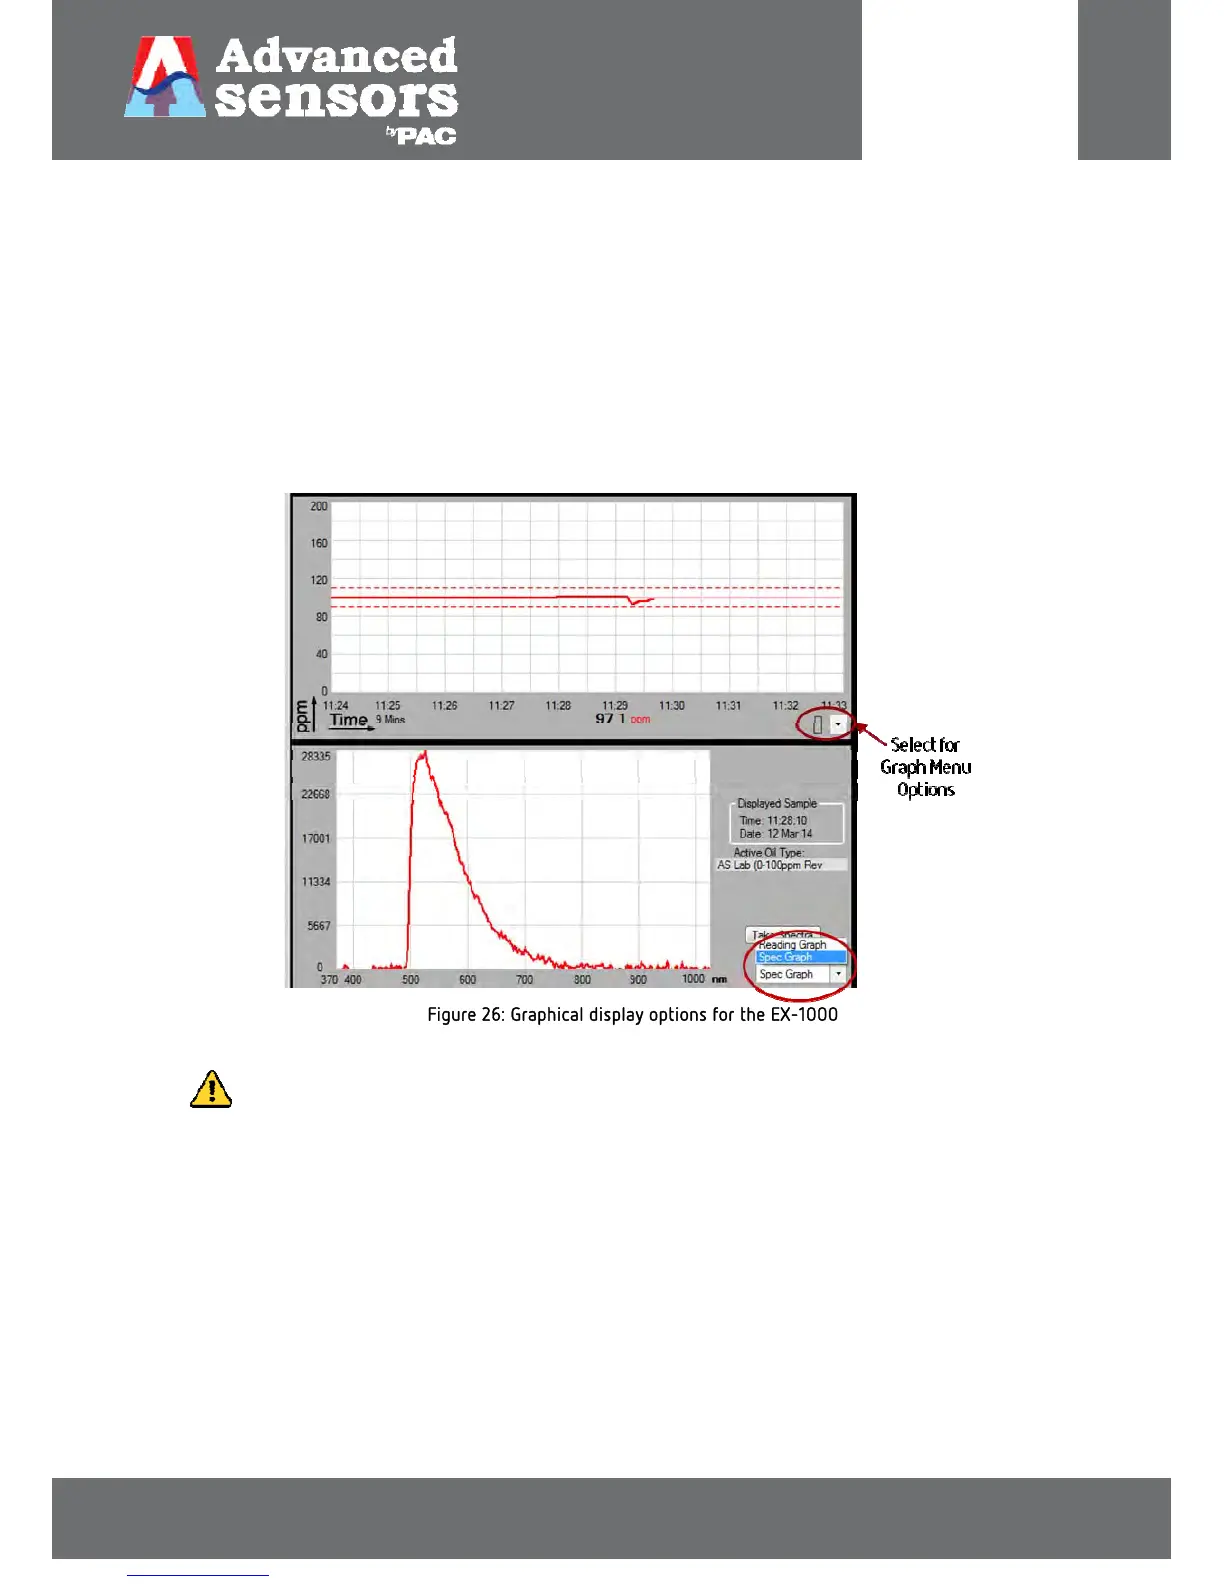
For EX-1000 Models:
The graphical displays (upper and lower) for the EX-1000 have the same basic ‘Graph Menu’ functions as the EX-100.
However, in the EX-1000 both upper and lower graphs have an additional drop down selection menu which allows the
user to select ‘Reading Graph’ or the ‘Spec Graph’ to display reading values or spectral data respectively. Figure 26
below is a graphical display showing a ‘Reading Graph’ (upper graph) and a ‘Spec Graph’ (lower graph). These displays
can show reading data, spectral data or both depending on the user’s requirements.
For additional information about the ‘Graph Menu’ options and configurations see Section 3.2.2 – Graphical Display
Areas.
Figure 26: Graphical display options for the EX-1000
INFORMATION: Additional Spectrometer information is available in the Spectrometer Handbook OIW-HBO-
005-EX-003.
 Loading...