45
HISTORY 1, information includes (Fig. 39A/B, page 44):
> Graphic HIST
> Total Dive Time up to 999:59:59 (hr:min:sec) maximum,
then 1000 - Hr, then start over at 0:01 (min:sec).
> Total number of Dives conducted (up to 9999) with DIVE
icon
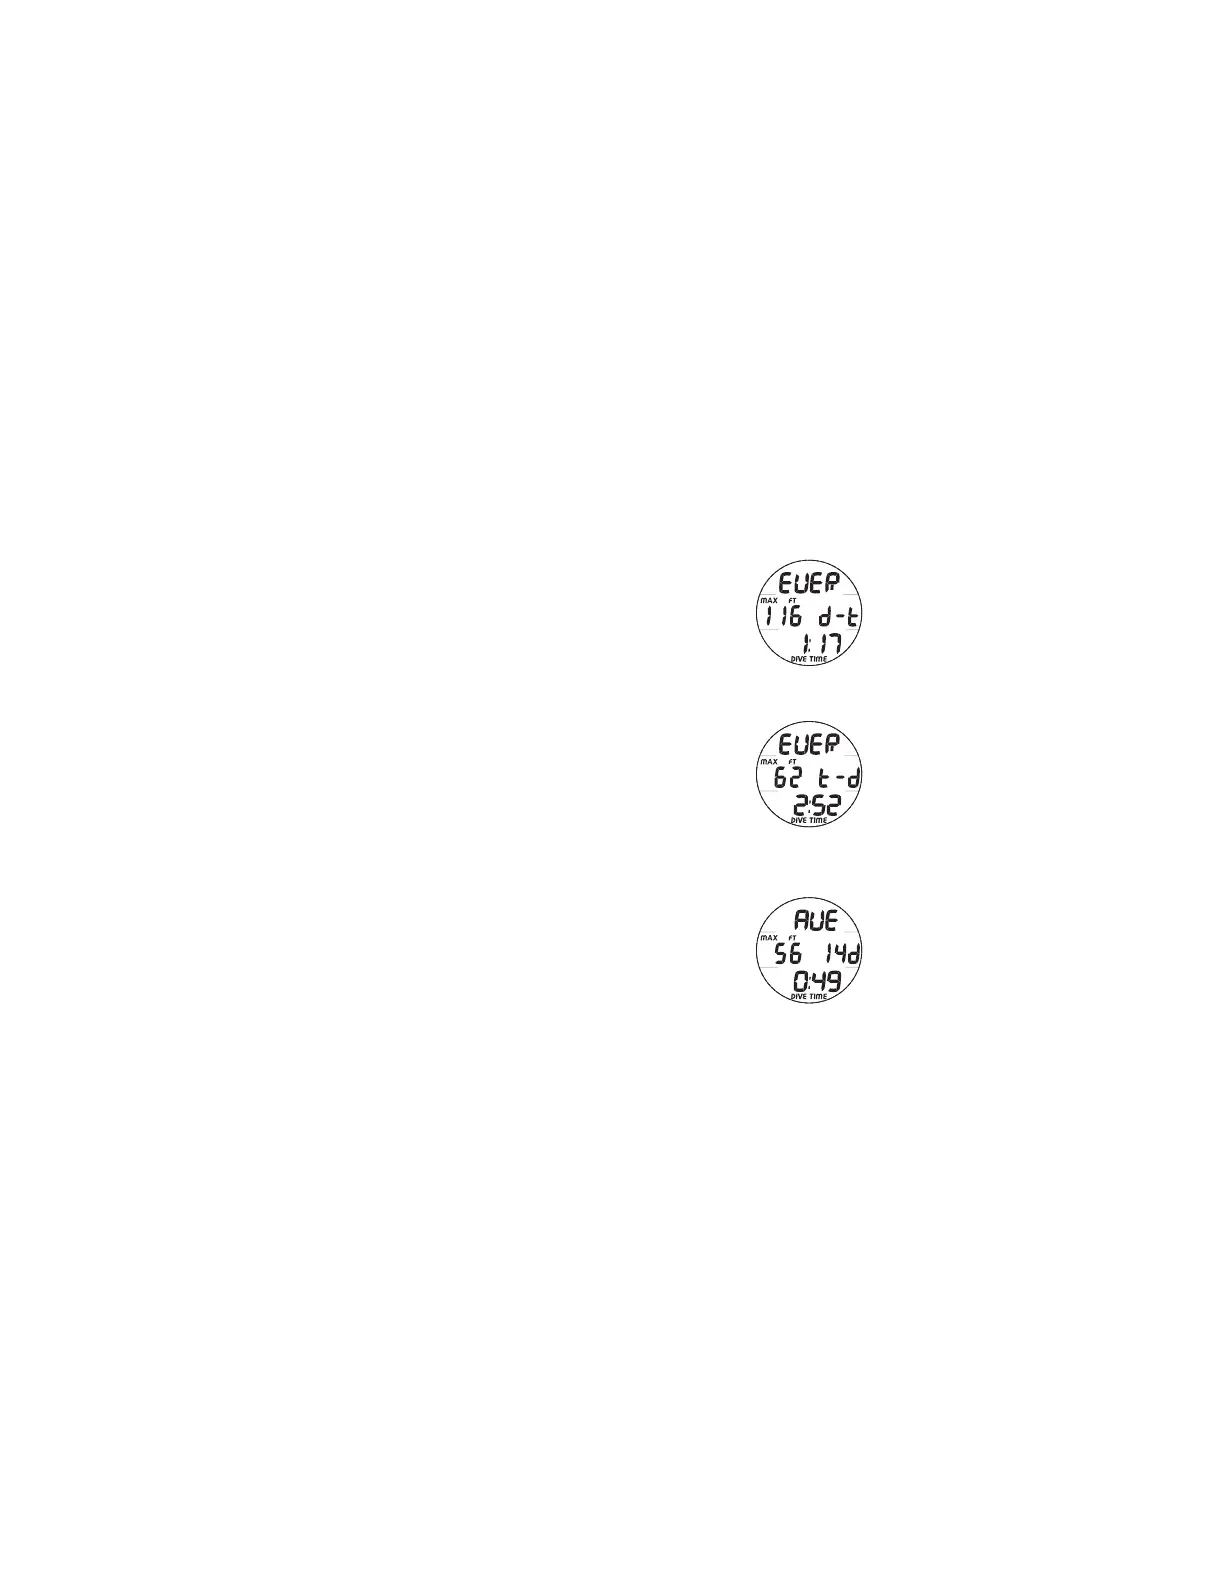
HISTORY 2, information includes (Fig. 40):
> Graphics EVER and d - t, indicating that the information
displayed is for the deepest Max Depth ever recorded and
the EDT displayed is associated with that Max Depth
> Max Depth ever achieved with MAX and FT (or M) icons
> EDT (mn:sec) for that dive with DIVE and TIME icons
HISTORY 3, information includes (Fig. 41):
> Graphics EVER and t - d, longest EDT ever recorded and
the Max Depth displayed is associated with that EDT
> Max Depth for the dive with MAX and FT (or M) icons
> EDT (mn:sec), longest ever, with DIVE and TIME icons
HISTORY 4, information includes (Fig. 42):
> Graphics AVE (meaning Averages)
> Max Depth with MAX and FT (or M) icons, average of all
dives ever recorded
> Graphic xxd, representing the average number of dives
conducted during each day of diving activity
> EDT (mn:sec), representing the average EDT of all dives
recorded, with DIVE and TIME icons
Fig. 40 - HISTORY 2
Fig. 42 - HISTORY 4
Fig. 41 - HISTORY 3