51
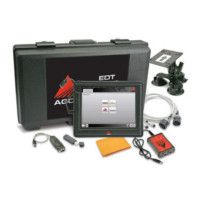
Network Summary
FIG.96 Network Summary shows a table of control units scanned from the CAN Bus.
The hardware and software will also be displayed on this page if the information is available.
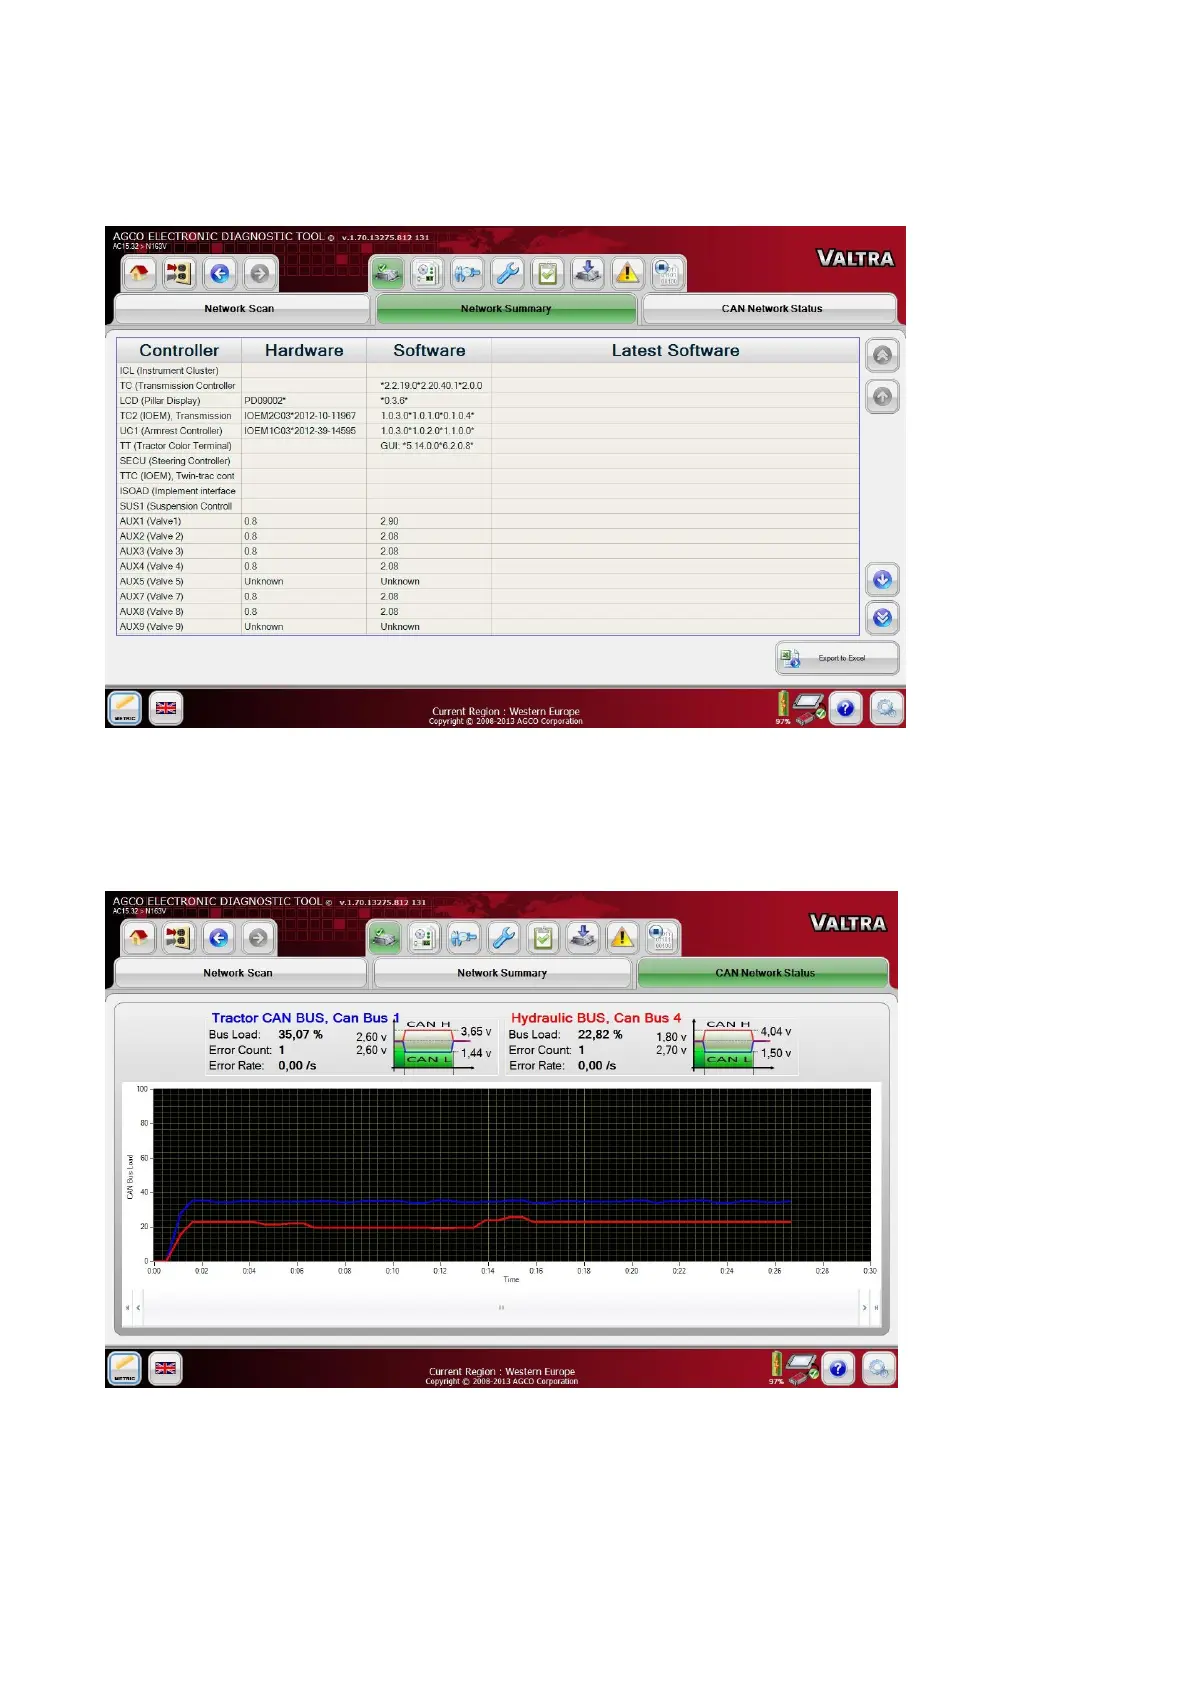
CAN Network Status
FIG.97 CAN Network Status shows a graph plotted between the CAN Bus Load in Percentage and Time. The Error
Count will also be displayed on this page.
The screen will display green and red lines showing normal and overload levels of the CAN network activity.