Option 100 Fault Location and SRL 4-17
Making SRL Measurements
How to Make and Interpret SRL Measurements
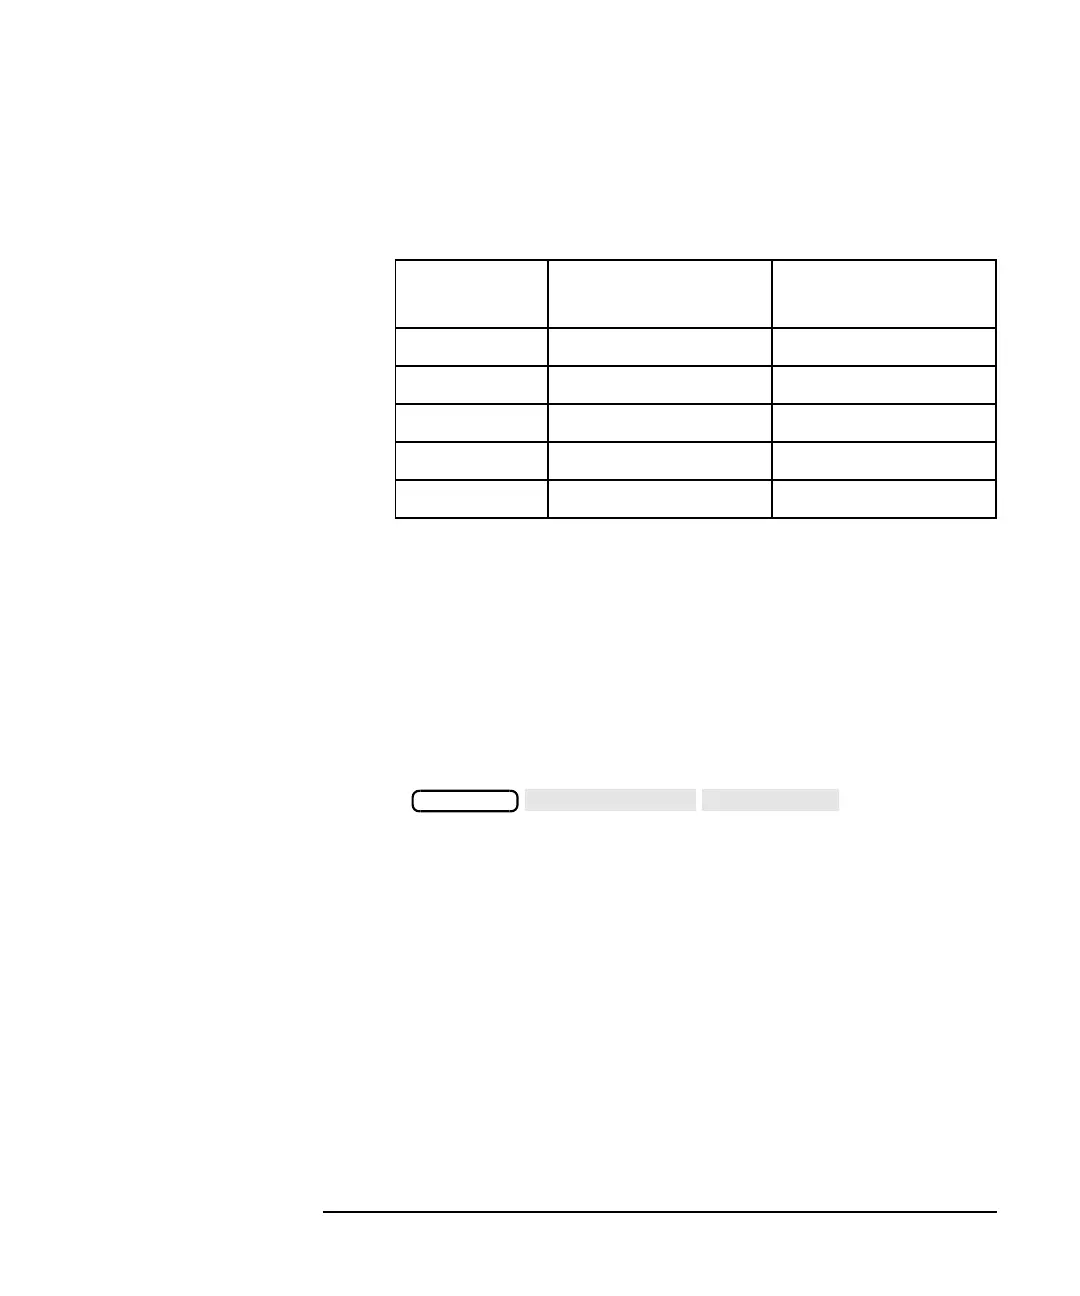
4. During the cable scan, the analyzer takes five sweeps of the cable at
the following frequencies:
Table 4-3 SRL Cable Scan Frequency Sweeps
5. After the last sweep, the analyzer then displays the worst-case
response among the five sweeps.
6. Note that the measured impedance is displayed at the top of the
analyzer's display area (see Figure 4-9).
7. You can use a limit line to quickly see if your cable has passed or
failed your SRL specifications. For an example of how to set a limit
line, see “5. Interpret the Measurement” on page 3-10. For more
detailed information, see “Using Limit Lines” in Chapter 4 of your
analyzer’s User's Guide.
8. Press to pinpoint the
worst case SRL response of the cable under test.
9. Figure 4-9 shows a typical SRL cable scan measurement response.
Sweep
Number
Start Frequency
(MHz)
Stop Frequency
(MHz)
1 5.000 999.500
2 5.125 999.625
3 5.250 999.750
4 5.375 999.875
5 5.500 1000.000
MARKER