INSTRUKCJA OBSŁUGI 49
____________________________________________________________________________________________________________________
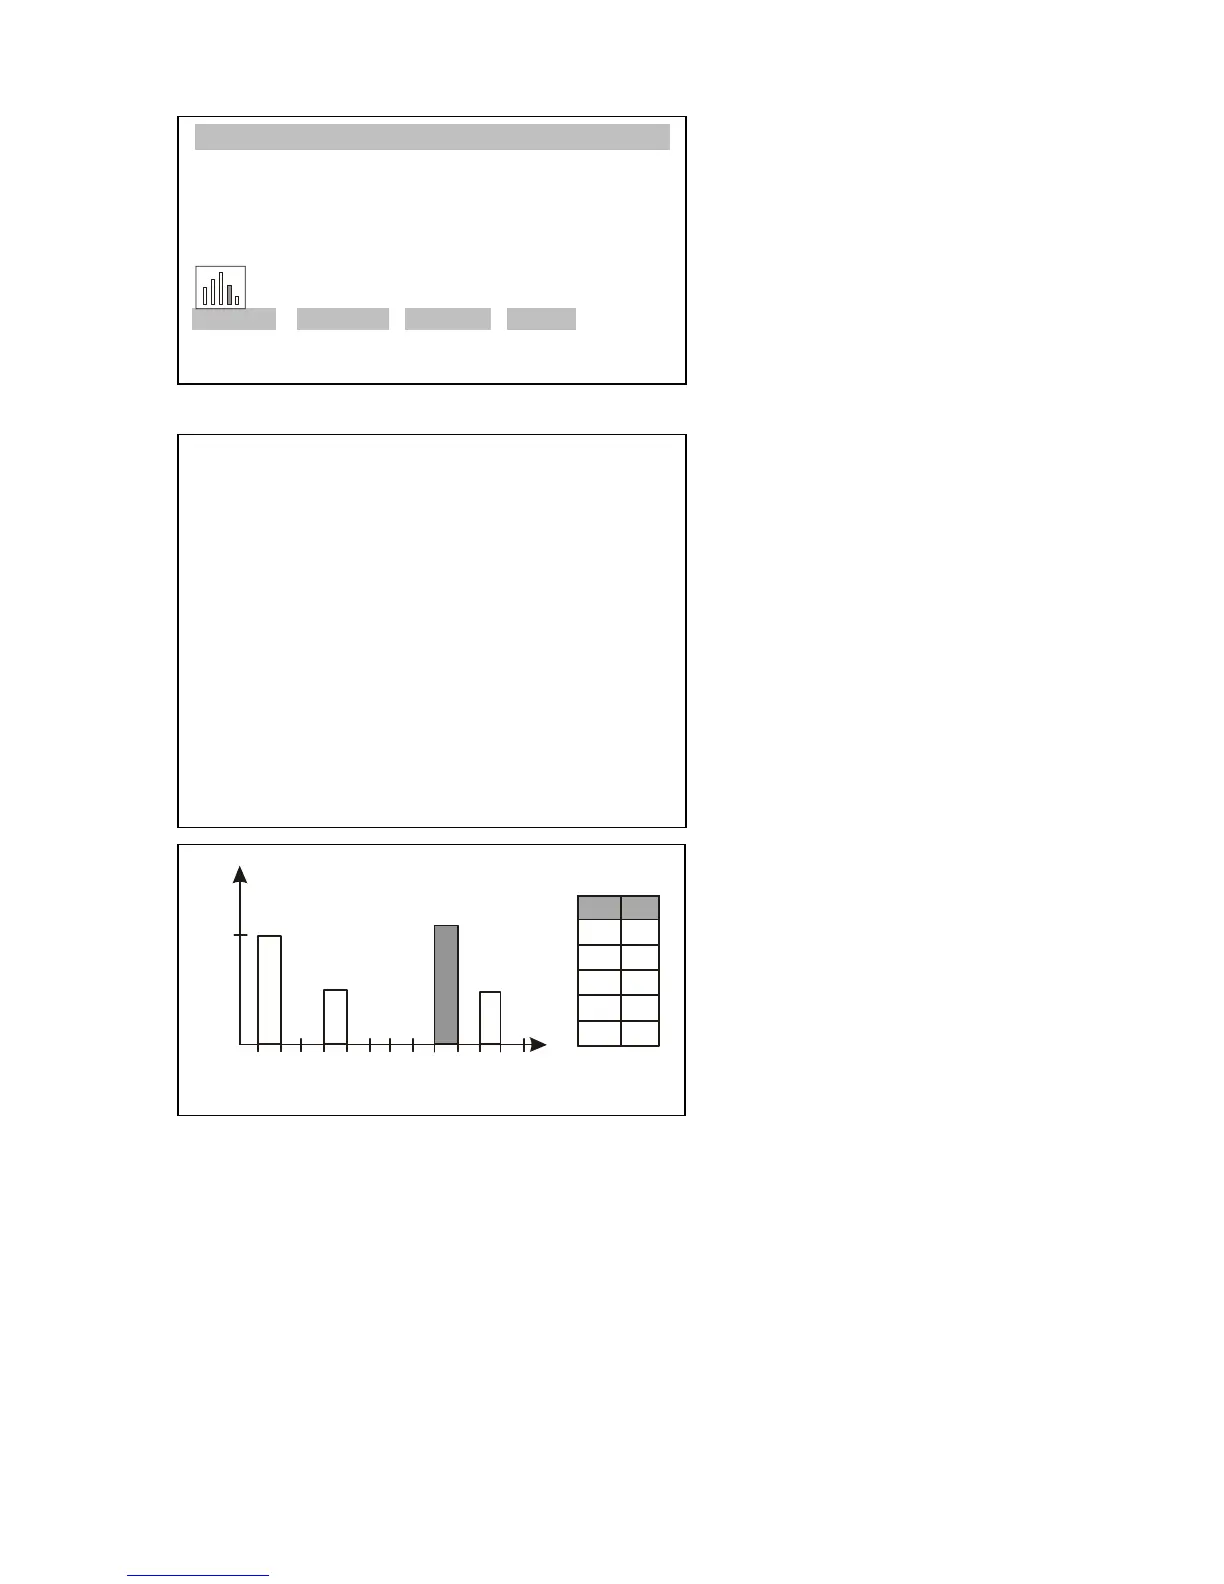
To read the statistical
parameters, press MENU key. It
will display report STATISTICS
– RESULTS.
The individual measurements
results are printed during
performing (option: Print ON).
After pressing F1 key the
statistical parameters are
printed.
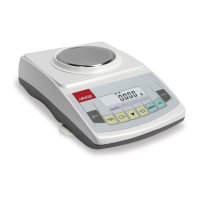
F2 key prints the histogram.
Table on the left shows division
into subranges (i) and numbers
of samples (n) in the individual
subranges. Return to report
displaying takes place after
pressing CLR key.
To finish the function operation, press MENU to enter the user functions menu,
select Statistics function, and select Deactivation option.