268
* The text on the buttons varies as shown below, depending on whether or not there are set
conditions.
No set conditions: "Filter"
Conditions have been set: "Change"
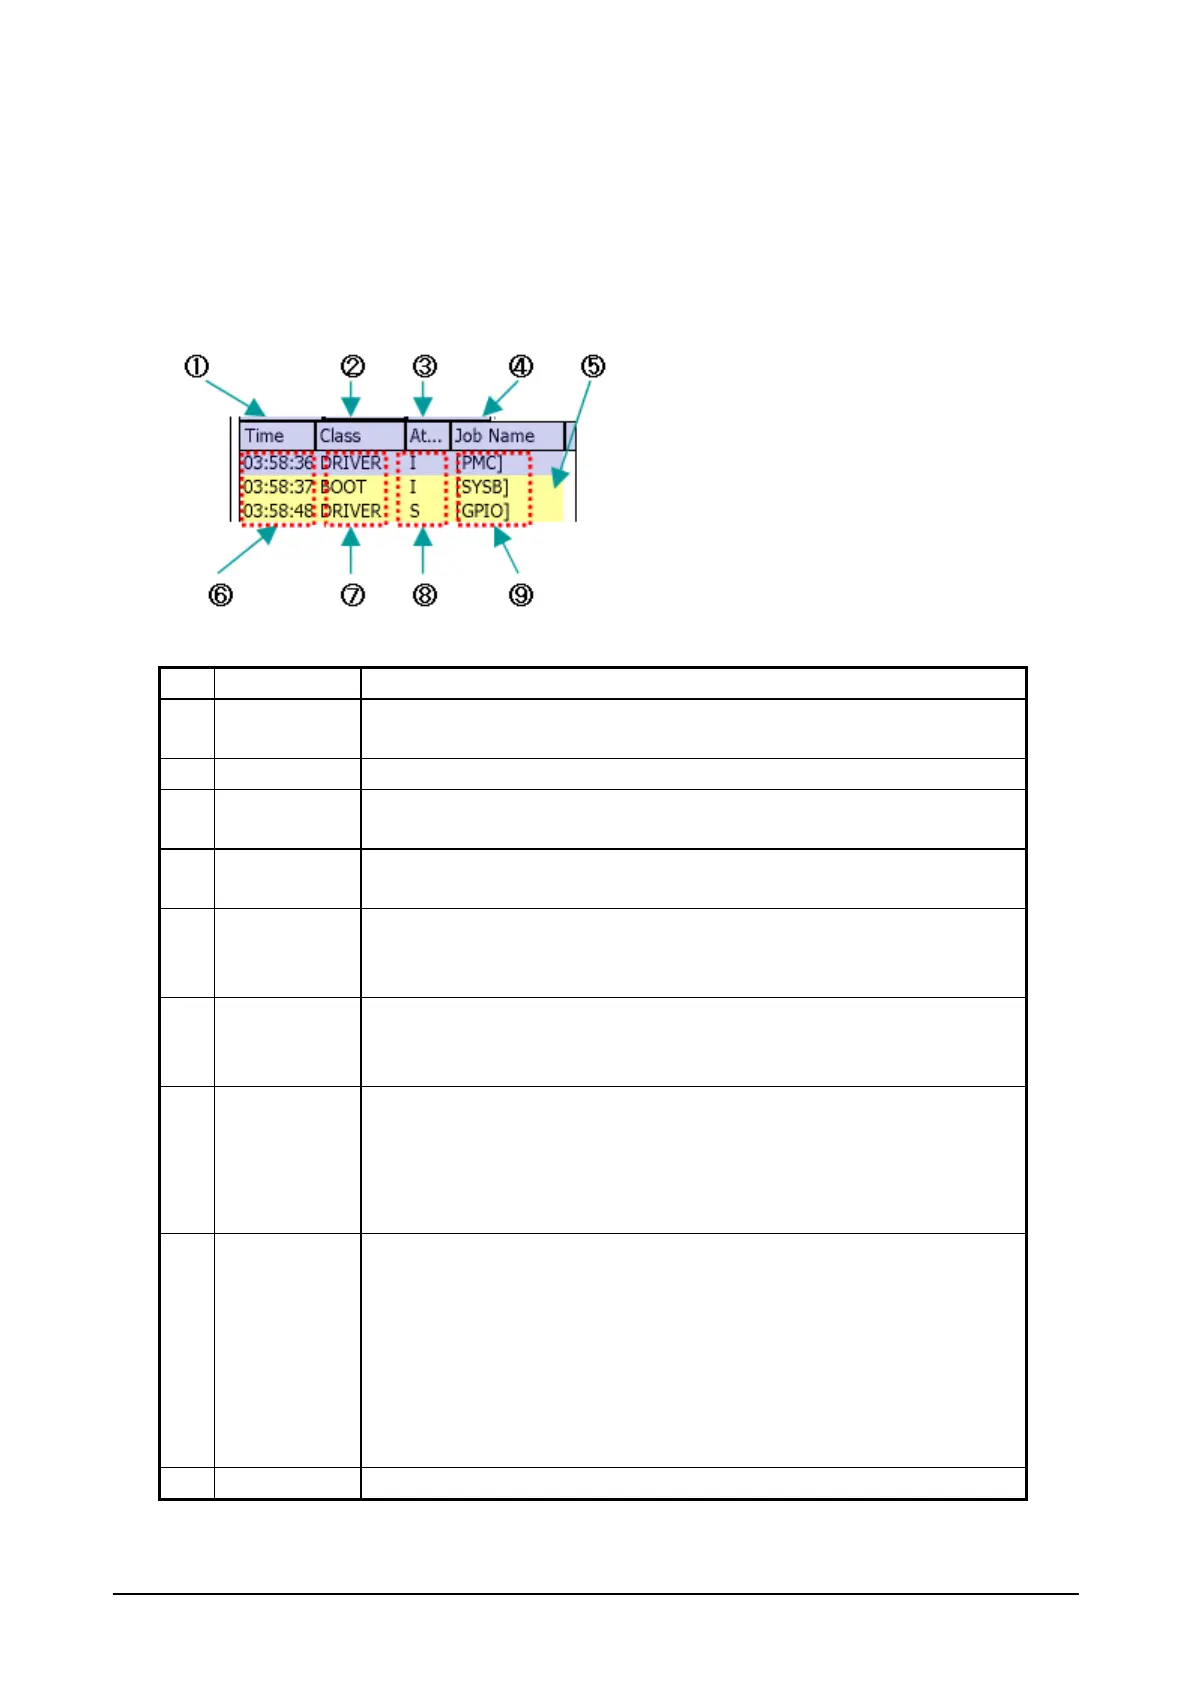
The display specification for the list area is as shown below.
No. Item Contents
1 Time header Sort the displayed logs by date and time generated, in ascending or
descending order.
2 Class header Sort the displayed logs by Class, in ascending or descending order.
3 Attribute
header
Sort the displayed logs by attribute, in ascending or descending
order.
4 Job name
header
Sort the displayed logs by process name, in ascending or descending
order.
5 Item area
background
color
Change the background colors used for the types of displayed logs.
System logs : Yellow
Execution logs : White
6 Time The times the displayed logs were generated are displayed in the
format HH:MM:SS.
Double click on this item to display the Details screen.
7 Class Indicates the types of logs on display clearly, with text and color.
System logs are indicated as either "OS", "Driver" or "Boot".
Execution logs are indicated as either "Information", "Start", "Normal
termination", "Abnormal termination", "Progress" or "Other (value
displayed)".
8 Attribute The log attributes of the logs on display are clearly indicated by
colors.
One of the following is displayed:
"I" : Information
"W" : Warning
"E" : Error
"S" : Monitoring successful
"F" : Monitoring failed
9 Job name Indicates the Job name for the displayed log.
 Loading...