© 1999-2017 Citrix Systems, Inc. All rights reserved. p.131https://docs.citrix.com
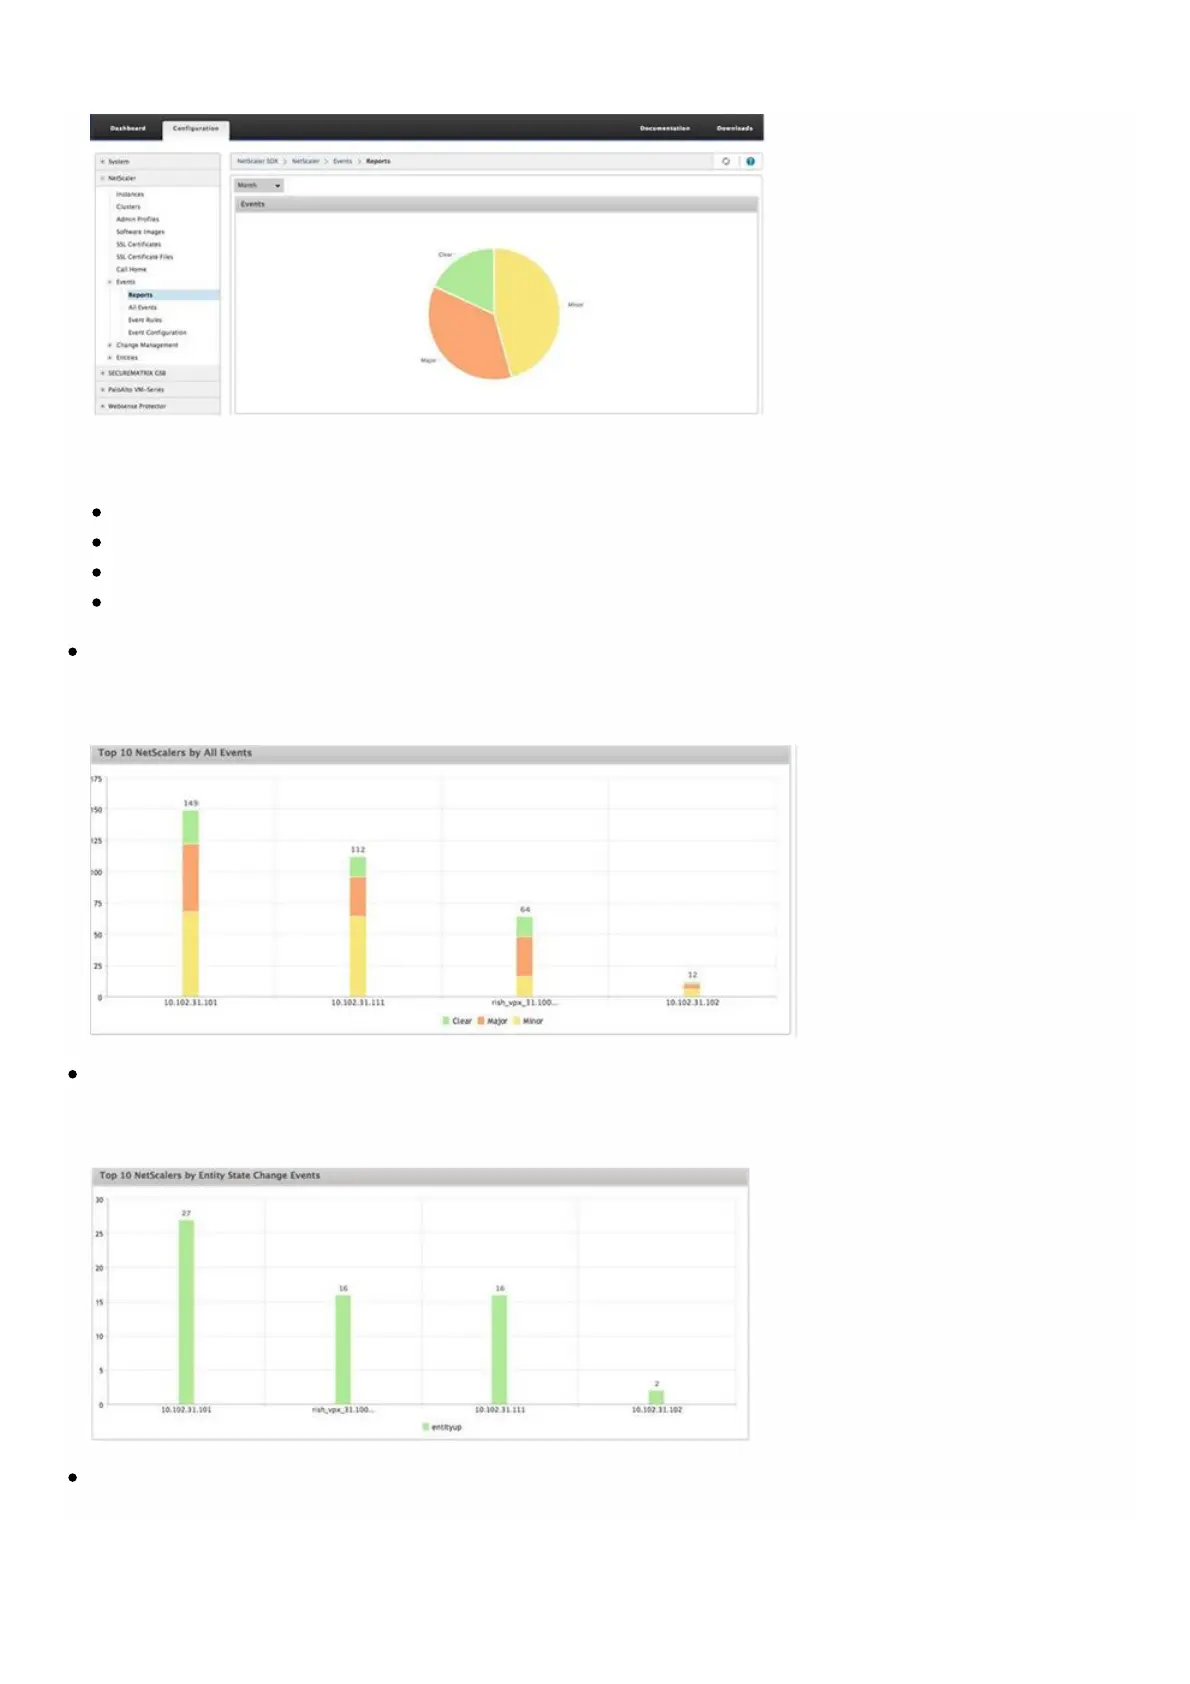
To view the details of the events of a particular severity, click that segment of the pie chart, you can view the following
details:
Source: System name, host name, or the IP address on which the event was generated.
Date: Date and time when the alarm was generated.
Category: Event category (for example, entityup).
Message: Description of the event.
Top 10 NetScaler Instances by All Events
This report is a bar chart that displays the top 10 NetScaler instances according to the number of events for the
selected time scale.
Top 10 NetScaler Instances by Entity State Change Events
This report is a bar chart that displays the top 10 NetScaler instances according to the number of entity state changes
for the selected time scale. The entity state changes reflect entity up, entity down, or out of service events.
Top 10 NetScaler Instances by Threshold Violation Events